Summary: Milestone Trend Analysis (MTA) is a simple yet powerful way to track how key project deadlines evolve over time. At regular intervals, the planned milestone dates are compared with their current forecasts and visualized as trend lines. This makes schedule shifts, stability, and emerging risks easy to spot—clear enough for non-experts and invaluable for reliably predicting project progress.
The Milestone Trend Analysis (MTA) is one of the most effective and easy-to-understand tools for monitoring project timelines. As a project manager, you know how quickly schedules can shift once ambitious plans and clearly defined milestones meet real-world challenges. Delays caused by resource shortages, changing requirements, or external dependencies are common—and often predictable.
Ultimately, every project manager wants to know one thing: When will the project really finish? This is where the Milestone Trend Analysis comes in. It provides a clear, visual way to identify schedule deviations early and react before they turn into bigger issues. Let’s explore how MTA works and why it’s so valuable in day-to-day project management.
Why is Milestone Trend Analysis so important?
The Milestone Trend Analysis enables you to evaluate your project schedule dynamically instead of relying on static snapshots. Project timelines almost always shift over time—usually toward later completion dates. In early phases, teams may still promise to “catch up later,” but delays often follow a pattern, such as overly optimistic planning. MTA uncovers these trends early, giving you the chance to intervene before stakeholders lose confidence or deadlines slip significantly.
A practical example: In one of my engineering projects, a supplier delayed delivering key components. The Milestone Trend Analysis revealed the issue within two weeks. Because we spotted the trend early, we were able to source alternative components and avoid major delays.
Benefits of Milestone Trend Analysis
- Early warning system: Spot schedule slippage before it becomes critical.
- Stronger decision-making: Reliable data supports discussions with stakeholders.
- More transparency: Everyone can see scheduling patterns at a glance.
- Continuous improvement: Over time, MTA helps refine your planning accuracy.
What is Milestone Trend Analysis?
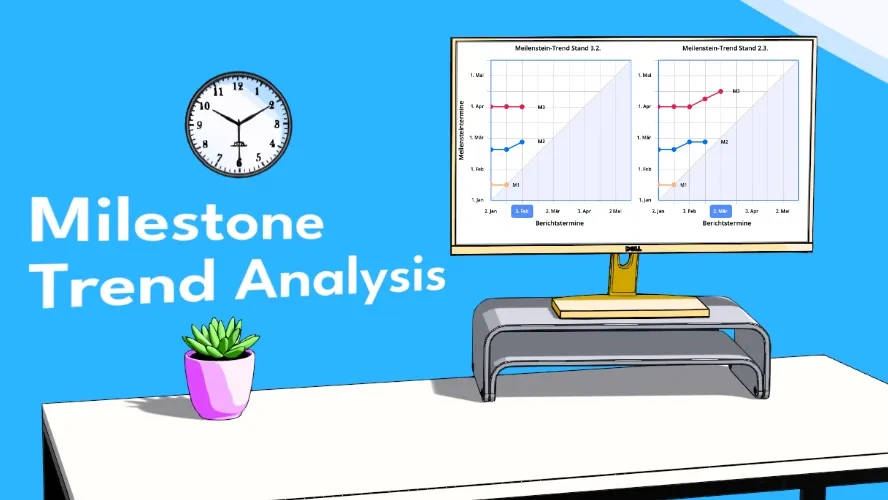
The Milestone Trend Analysis visualizes how projected milestone dates evolve over time. The method uses a simple two-axis diagram:

- The X-axis represents the reporting dates—the times when you review the schedule.
- The Y-axis represents the projected milestone completion dates.
The resulting trend lines show whether each milestone is on track, at risk, or slipping over time.
Typical patterns
- Stable lines: The milestone is consistently achievable.
- Downward lines: Completion is earlier than planned—rare but positive.
- Upward lines: A clear sign of emerging delays.
In one software project, a steep upward trend appeared for a critical integration milestone. The MTA revealed that an external tool dependency was behind schedule. Thanks to this visibility, the team implemented a workaround early and avoided a major delay.
How to create a Milestone Trend Analysis
Step 1: Define your milestones
Strong MTAs rely on clearly defined milestones, usually taken from a detailed project plan. Milestones should:
- Describe concrete deliverables (e.g., “prototype completed”).
- Be SMART: specific, measurable, achievable, relevant, and time-bound.
Typical milestones in technical projects include design completions, test phase approvals, and production releases.
In one project, vague milestones regularly caused misunderstandings. After switching to SMART-defined deliverables—such as released documents or approved prototypes—the project progressed much more smoothly.
Step 2: Collect data regularly
To identify trends, you must track milestone predictions at regular intervals, ideally weekly or biweekly, depending on project complexity.
Pro tip:
Tools like Allegra automatically provide milestone data for MTA charts. If you prefer manual work, spreadsheet templates also work well:
Step 3: Create the diagram
Plot the collected data. Each reporting date adds a new point for each milestone. Trend lines emerge automatically and reveal the true trajectory of your project. Good project management software generates these charts instantly.
Common mistakes—and how to avoid them
1. Too many milestones
Milestones are not tasks. Overuse leads to cluttered diagrams. Focus on critical checkpoints such as phase completions or significant deliverables.
2. Vague milestone definitions
Each milestone must correspond to a clear, verifiable outcome.
3. Irregular data collection
Skipping reporting dates creates gaps and reduces the usefulness of the analysis. Stick to your schedule—even during stressful phases.
4. Misinterpreting trends
An upward line is not always a crisis, but it demands investigation. Understand the cause before reacting.
5. Using inconsistent time axes
Both axes should share the same time reference to avoid confusion.
Example: Milestone Trend Analysis in an IT project
Imagine you lead an ERP implementation project with these milestones:
- Requirements analysis completion (M1 – Jan 15)
- System design completion (M2 – Feb 18)
- Test phase completion (M3 – Apr 2)
- Go-live (M4 – May 12)
You record projections twice per month. At each reporting date, you update the milestone timeline and monitor trends.
The test phase (M3), for example, shows repeated delays. Thanks to the MTA, you discover the root cause early: a lack of testers. By scaling the test team, you prevent delays to the go-live date.
Integrate the Milestone Trend Analysis into your projects
MTA works best when combined with complementary project management tools:
- Risk management to identify early threats.
- Earned Value Analysis (EVA) for cost and performance insights.
- Gantt charts for dependencies and workflows.
- Burndown charts for agile progress tracking.
Together, these tools give you a complete view of schedule stability, budget performance, and team throughput.
Conclusion: Why Milestone Trend Analysis matters
The Milestone Trend Analysis is a must-have tool for any project manager who wants to detect schedule risks early and deliver projects reliably. MTA increases transparency, strengthens communication, and improves long-term planning accuracy.
Final tip: Make MTA a recurring agenda item in your project meetings. Regular discussions with your team and stakeholders build trust and ensure everyone stays aligned.
Checklist: Successful Milestone Trend Analysis
- Define milestones clearly and ensure they are SMART.
- Collect milestone forecasts consistently.
- Visualize trends with clean charts.
- Communicate results and take action where needed.
- Review lessons learned to improve future planning.
By following these steps, you can keep your project on track—even when challenges arise. And may your trend lines always remain horizontal!
Frequently Asked Questions
Was ist die Meilensteintrendanalyse?
Die Meilensteintrendanalyse ist eine Methode zur grafischen Darstellung der zeitlichen Entwicklung von Meilensteinterminen in einem Projekt. Sie hilft, Abweichungen frühzeitig zu erkennen.
Warum ist die Meilensteintrendanalyse wichtig?
Sie ermöglicht es Projektmanagern, Verzögerungen zu erkennen und proaktiv Maßnahmen zu ergreifen. Dadurch werden Projekte effizienter gesteuert.
Wie funktioniert die Meilensteintrendanalyse?
Daten zu Meilensteinen werden regelmäßig erhoben und grafisch als Trendlinien dargestellt. Diese Linien zeigen, ob ein Meilenstein stabil, verzögert oder vorzeitig erreicht wird.
Welche Vorteile bietet die Meilensteintrendanalyse?
Zu den Vorteilen zählen Transparenz, fundierte Entscheidungsgrundlagen, die frühzeitige Erkennung von Problemen und die Verbesserung der Planungsgenauigkeit.
Welche Werkzeuge eignen sich für die Meilensteintrendanalyse?
Gängige Werkzeuge sind Allegra, Microsoft Project, Excel und spezialisierte Projektmanagement-Tools mit Diagrammfunktionen.

Editor and Writer
Gabriella Martin is a Yale University graduate and holds a Master's degree in German Literature from the University of Tübingen. She loves explaining complex things in simple terms.