Summary: Earned Value Analysis (EVA) is a method for project controlling. It combines planned and actual performance as well as costs of a project. This makes it possible to see early on—backed by hard data—whether a project is on time and within budget.
Want to steer your projects more effectively, keep costs under control, and avoid time overruns? Then Earned Value Analysis (EVA) is exactly what you need. You may also encounter this project management method under the names Performance Value Method and Earned Value Management. This tool requires a small additional effort in project management, but it’s brilliant. Let’s take a look at how you can use EVA to prove yourself once again as a successful project manager.
But first, a brief look back: The Earned Value Analysis method has its origins in the American defense sector of the 1960s. It was introduced to better control large and complex projects. The government wanted to ensure that schedules were met and taxpayer money was used efficiently. The goal was to create a standardized method for project controlling that measures progress and makes both time and financial deviations visible. This concept quickly became a model for other industries that also work with large project budgets and tight deadlines.
What Is Earned Value Analysis?
Earned Value Analysis is not rocket science—even though it’s frequently used in technical projects. At its core, it’s about measuring a project’s progress by relating cost, time, and performance. It combines planned work, completed work, and the resources spent on it in a single method.
Imagine you’re building a house. You plan to lay the foundation in the first week. You’ve budgeted €5,000 for it. After one week, you find the foundation is complete, but it cost €6,000. Where do you stand? And how much will the complete house likely cost? The extra €1,000 probably won’t be the end of it, right? This is exactly where EVA comes in—it helps you evaluate such situations.
The method is not only theoretically sound but has proven itself in countless projects. In a way, it makes the key metrics of the Magic Triangle quantifiable and visible. It works for small and large projects alike and delivers concrete answers to the question of where things stand in terms of time and cost. The only important thing is: you need to understand the basics before you can successfully apply EVA.
Why Is Earned Value Analysis Important?
Projects are somewhat like sailboats: without clear steering and constant monitoring of influencing factors, they quickly lose direction. EVA provides exactly this steering.
More Transparency
With EVA, you always know where your project stands. You see not only how much you’ve spent, but also whether those expenditures are proportionate to the work delivered. No guesswork, no gut decisions.
This transparency has another advantage: you can deliver well-founded reports to your stakeholders. When someone asks why the project costs more than expected, you have the answers ready. This builds trust and reduces conflicts, and it works in any form of project organization.
Early Warning Signals
One of my biggest lessons as a project manager? Recognizing problems early is the key. With EVA, you can quickly identify deviations and take corrective action before your project spirals out of control.
An example from practice: In a project developing a new machine model, increased material costs were noticed after just a few weeks. Thanks to EVA, we were able to quickly find and fix the planning error. Without this method, we would have reacted much later—probably too late.
Objective Decision-Making Basis
Many decisions in project management are based on assumptions. EVA reduces this risk. Through a clear presentation of actual figures and deviations, you can make well-founded decisions. This is especially important when it comes to budget increases or deadline extensions.
How Does Earned Value Analysis Work?
EVA is based on three central metrics. Don’t worry—it’s simpler than it sounds.
Planned Value (PV)
The Planned Value is the value of the work you planned to complete by a certain point in time. Example: Going back to your house construction, you wanted to have 50% of the foundation complete after two weeks. That corresponds to a Planned Value of €2,500.
A planned value gives you a baseline for evaluating your progress. It’s important that you record the PV in your project plan. You should only change it if the conditions under which you created the original plan have changed.
Earned Value (EV)
The Earned Value indicates how much work you’ve actually completed—measured in working hours or financial terms. If 40% of the foundation is done after two weeks, the Earned Value is €2,000.
The Earned Value is the linchpin of the analysis. It gives you a clear picture of whether you’ve achieved the planned performance or not.
Actual Cost (AC)
The Actual Cost is the costs actually incurred. If you’ve spent €3,000 up to this point, that’s your AC.
What’s special about AC is that it’s directly measurable. There’s no room for interpretation—just clear numbers.
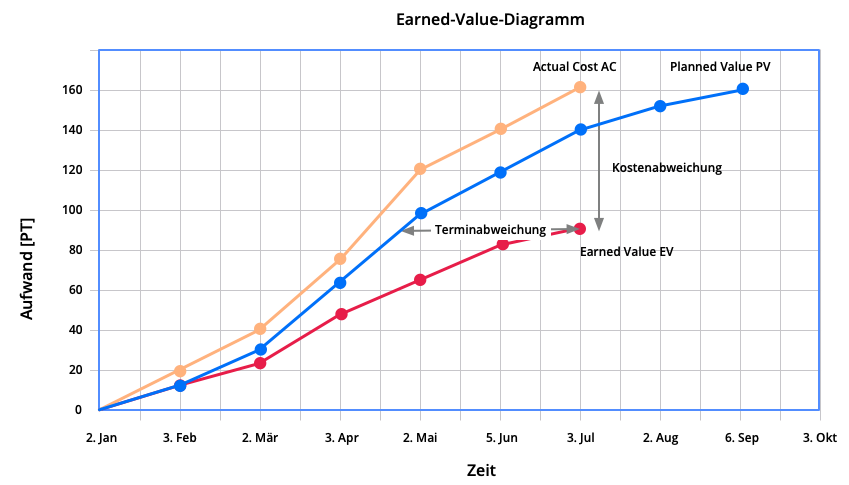
The Magic of Combination
When you compare these three values with each other, you get a comprehensive picture of your project. Are you above or below plan? And are your expenditures justified? That’s exactly what you want to know to steer your project safely.
A Detailed Example for Illustration
Let’s say you’re managing a software development project. Your goal is to develop a new app in three months. The total budget is €150,000. After one month, you’ve spent €50,000. According to your plan, you should have completed 40% of the project by this point (Planned Value = €60,000). However, your developers report that only 30% of the work is done (Earned Value = €45,000).
- Cost Variance (CV): EV - AC = 45,000 - 50,000 = -5,000 euros. The project is more expensive than planned.
- Schedule Variance (SV): EV - PV = 45,000 - 60,000 = -15,000 euros. The project is behind schedule.
- Cost Performance Index (CPI): EV / AC = 45,000 / 50,000 = 0.9. For every euro spent, you’re only getting 90 cents worth of value.
- Schedule Performance Index (SPI): EV / PV = 45,000 / 60,000 = 0.75. You’ve completed 75% of the planned work.
These numbers clearly show that the project is behind both in terms of time and budget. With this information, you can take targeted measures, such as reallocating resources, adjusting the schedule, or reviewing the cost structure. This example illustrates how EVA helps you make informed decisions and get your project back on track.
Which Key Metrics Are Critical?
Here comes the exciting part. With EVA’s key metrics, you transform raw data into solid insights.
Cost Variance (CV) and Schedule Variance (SV)
- Cost Variance (CV): EV - AC. Unexpectedly high costs? A negative CV tells you that you’re over budget.
- Schedule Variance (SV): EV - PV. Delays? A negative SV means you’re falling behind schedule.
Cost Performance Index (CPI) and Schedule Performance Index (SPI)
- CPI: EV / AC. A value below 1 indicates that your project is more costly than planned.
- SPI: EV / PV. A value below 1 means your project is behind schedule.
Forecasting and Control
EVA’s key metrics are not only helpful for understanding the current status. They’re also a valuable tool for creating forecasts. If your CPI is consistently at 0.9, you know that you’ll likely end up 10% over budget. With this information, you can take corrective action early.
How Is EVA Applied in Practice?
The theory is exciting, but how do you concretely implement EVA? Here’s a step-by-step guide:
1. Project Planning
Without a solid plan, EVA is useless. Define clear work packages, schedules, and budgets. Every task should be measurable. Project planning is the foundation of EVA. Without clear goals, you can’t measure deviations.
2. Regular Data Collection
Track the progress of your tasks, the costs incurred, and the milestones reached. Without current data, EVA is like a compass without a needle. Make sure your teams are trained and know how to deliver the necessary data.
3. Analysis and Actions
Use the key metrics to identify problems. Is your CPI below 1? Then look for cost-saving opportunities. Is your SPI critical? Find out why the schedule isn’t being met. Analysis is an ongoing process. You need to be flexible enough to respond to changes.
4. Communication
EVA is only as effective as the way you communicate its results. Make sure all stakeholders understand the reports and know what consequences the results have. In a matrix organization, don’t forget to inform the leaders.
Which Tools Support EVA?
A good captain needs the right instruments. The same goes for project managers. Here are some of the best tools for EVA:
- MS Project: Perfect for comprehensive project plans.
- Primavera P6: A favorite for large technical projects.
- Allegra: Hidden champion for pragmatic project management.
- Excel: Often sufficient for smaller projects—provided you know your formulas.
Tip:
Try out different tools and find out which one best suits your style and your project. Remember that a tool is only as good as the person using it.
What Mistakes Should Be Avoided?
EVA is only as good as the data you feed into it. Here are some typical mistakes and how to avoid them:
- Unclear goal definitions: Without clear goals, you don’t know what success means.
- Faulty data collection: Inaccurate or delayed data makes EVA worthless.
- Ignoring results: The best analyses are useless if you don’t act on them.
I once forgot to train a team member on how to correctly report progress data. The result? Incorrect CV and SPI values that cost us nearly a month to correct.
Continuous Improvement
EVA is a learning process. Use the experiences from each project to improve your methods. Mistakes are inevitable, but they also offer the best lessons.
Comparison with Burn-Down Charts and Milestone Trend Analysis
Earned Value Analysis (EVA) is an effective tool, but how does it compare to other widely used methods like burn-down charts and milestone trend analysis? Let’s take a closer look.
Burn-Down Charts
Burn-down charts are particularly popular in agile projects. They visualize how much work remains and help track progress against the planned timeline. The advantage: they’re easy to create and interpret. However, they often lack the depth that EVA provides. A burn-down chart doesn’t show you whether you’re exceeding your budget or whether your costs are proportionate to performance. In complex projects, such information can be critical.
Milestone Trend Analysis
Milestone trend analysis focuses on meeting milestones and their schedule trends. It’s ideal for detecting schedule delays and is especially helpful for projects with clearly defined phases. What it lacks, however, is the integration of cost data. EVA goes a step further by linking cost and schedule deviations, thus providing a more comprehensive picture.
Summary
While burn-down charts and milestone trend analysis are simple and specific tools, EVA offers a deeper analysis that combines cost, time, and performance. Choosing the right project management tool ultimately depends on your project’s requirements. In many cases, a combination of methods can deliver the greatest benefit.
How Do You Convince Stakeholders of EVA?
Not everyone loves numbers and analysis. EVA requires collecting and monitoring a few additional data points that your project team members need to maintain. They may not always see the personal benefit. Here are a few tips for winning over stakeholders:
- Explain the benefit: Show how EVA reduces costs and mitigates risks.
- Visualize the data: A simple chart often says more than a thousand words.
- Deliver results: Use examples to show how EVA has improved your project.
Summary
Earned Value Analysis is not a cure-all, but it’s an indispensable tool for project managers who want to ensure their project’s success. With clear numbers, constant monitoring, and timely actions, you stay on course—no matter how stormy the project gets.
Take the time to integrate EVA into your projects. Your projects—and your team—will thank you for it. And don’t forget: every step toward improvement makes you an even better project manager.
Frequently Asked Questions
What is Earned Value Analysis?
Earned Value Analysis (EVA) is a method that measures a project’s progress by combining cost, time, and performance. It helps identify deviations and steer projects more effectively.
What advantages does Earned Value Analysis offer?
EVA provides transparency about a project’s time and costs, identifies deviations early, and enables informed decisions. It reduces risks and optimizes project controlling.
How does Earned Value Analysis work?
EVA is based on three central values: Planned Value (PV), Earned Value (EV), and Actual Cost (AC). By comparing these values, key metrics such as Cost Variance (CV) and Schedule Variance (SV) emerge, which evaluate project progress and efficiency.
When should Earned Value Analysis be used?
EVA is suited for projects with clearly defined goals, budgets, and schedules. It’s frequently used in large, complex projects but is also helpful for smaller endeavors.
Which tools support Earned Value Analysis?
Among the most popular tools are MS Project, Primavera P6, and Excel. These tools support the collection and analysis of project metrics to apply EVA efficiently.

Jörg Friedrich
Senior Advisor
Jörg Friedrich is the original author of the project management software Allegra and continues to accompany its development to this day. He has many years of industry experience as a project and department manager. He also serves as a professor in the Faculty of Computer Science and Information Technology at Esslingen University of Applied Sciences.