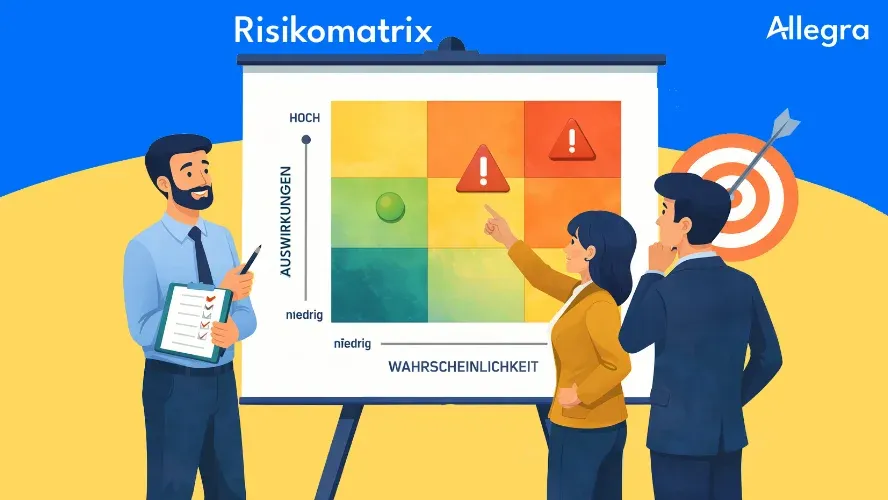
What is a risk matrix?
A risk matrix — also called a risk assessment matrix or risk map — is a tool of risk management that classifies risks visually according to two criteria:
- Probability of occurrence: How likely is it that the risk will occur?
- Impact: How severe would the consequences be for the project?
The probability of occurrence forms the vertical axis (Y-axis) and the impact forms the horizontal axis (X-axis). Each identified risk is positioned as a point in this matrix based on its rating. The resulting position determines the risk category — from “very low” to “critical.”
The risk matrix is a central output of risk assessment. It transforms an abstract list of risks into a picture that shows at a glance where action is needed. It is therefore one of the most important communication tools in project management — understandable to the project team as well as to clients and senior management. How the matrix, countermeasures, and risk register work together in a real project is demonstrated step by step in our risk management example.
Structure of a risk matrix
The two axes
The Y-axis shows the probability of occurrence — typically in levels from “very low” to “very high.” The higher a risk sits in the matrix, the more likely it is to occur.
The X-axis shows the impact — in levels from “insignificant” to “catastrophic.” The further right a risk sits, the more severe its consequences for the project’s time, cost, or quality.
The combination of both values produces the risk priority number (RPN):
RPN = Probability of occurrence × Impact
The RPN determines which zone of the matrix a risk lands in — and therefore how urgently it needs to be addressed.
Color coding
The color coding makes the risk category immediately recognizable:
- Green (Low / Very low): Monitor risks, no immediate action required
- Yellow (Medium): Plan countermeasures, review risks regularly
- Orange (High): Prioritize countermeasures and implement them promptly
- Red (Critical): Immediate action required, escalate to project management
The following graphic shows a complete 5×5 risk matrix:

Rating scales: 3×3 or 5×5?
The choice of rating scale depends on the level of detail your project requires. Both variants have their place.
The 3×3 risk matrix
The simplest form works with three levels per axis. It is suitable for small projects, early project phases, or an initial rough assessment.
| Low | Medium | High | |
|---|---|---|---|
| High | Medium | Critical | Critical |
| Medium | Low | Medium | Critical |
| Low | Low | Low | Medium |
Rows = probability of occurrence, columns = impact
Advantage: Quick to create, easy to understand, little debate over the correct classification.
Disadvantage: Limited differentiation. Many risks end up in the same category — a moderately likely risk with a moderate impact and an almost certain risk with a low impact both receive the rating “medium.”
The 5×5 risk matrix
The 5×5 matrix offers finer gradations and is the standard in professional project management. It enables more precise prioritization.
| Insignificant | Low | Medium | Severe | Catastrophic | |
|---|---|---|---|---|---|
| Very high | Medium | High | Critical | Critical | Critical |
| High | Low | Medium | High | Critical | Critical |
| Medium | Low | Low | Medium | High | Critical |
| Low | Very low | Low | Low | Medium | High |
| Very low | Very low | Very low | Low | Low | Medium |
Rows = probability of occurrence, columns = impact
Advantage: More differentiated classification, better basis for prioritization decisions.
Disadvantage: More discussion needed when assigning ratings. The distinction between adjacent levels (e.g., “low” vs. “medium”) requires clear, pre-defined criteria.
Which scale should you choose?
For projects with fewer than ten identified risks, a 3×3 matrix usually suffices. From ten risks onward, or for more complex projects, the 5×5 variant is recommended. The key point is: define the levels before the assessment. If “medium” means something different to every team member, the matrix loses its value.
Creating a risk matrix: step by step
1. Identify risks
Before you create a risk matrix, you need a complete list of risks. Use proven methods: team brainstorming, checklists from previous projects, SWOT analyses, or expert interviews. You can find a detailed guide in our article on identifying project risks.
2. Define the rating scale
Define the levels for both axes — concretely and transparently. Abstract terms like “medium” or “high” need measurable criteria; otherwise each team member will assess based on their own perception.
Example scale definition:
| Level | Probability of occurrence | Impact |
|---|---|---|
| 1 – Very low | < 10 % | Barely noticeable, no plan change needed |
| 2 – Low | 10–30 % | Minor delay or additional costs (< 5 %) |
| 3 – Medium | 30–60 % | Noticeable deviation, additional costs 5–15 % |
| 4 – High | 60–85 % | Significant deviation (15–30 %), scope at risk |
| 5 – Very high | > 85 % | Project objective at risk, massive overrun |
Adapt the criteria to your project. A software project defines “severe impact” differently than a construction project. What matters is that all stakeholders use the same scale.
3. Assess risks
Rate each identified risk on both scales. This is best done as a team — different perspectives lead to more realistic assessments. When opinions differ, discuss them. The discussion is often more valuable than the result, because it surfaces assumptions.
We describe detailed methods for risk assessment in our article on evaluating risks.
4. Enter risks into the matrix
Position each risk in the matrix based on its rating. The intersection of probability of occurrence and impact gives the risk category. For risks with an identical category, you can further differentiate using the risk priority number (probability × impact).
5. Derive countermeasures
The position in the matrix determines the urgency:
- Critical risks (red): Define and implement risk countermeasures immediately. Escalate to project management.
- High risks (orange): Prioritize countermeasures and initiate them promptly.
- Medium risks (yellow): Plan countermeasures, review regularly.
- Low risks (green): Monitor and document in the risk register.
Practical example: risk matrix for an IT migration project
A company is migrating its ERP system to a new platform. The project team has identified and assessed five key risks:
| Risk | Probability (P) | Impact (I) | RPN | Category |
|---|---|---|---|---|
| R1: Data loss during migration | Medium (3) | Catastrophic (5) | 15 | Critical |
| R2: Key developer leaves the project | Low (2) | Severe (4) | 8 | Medium |
| R3: Interface with third-party system incompatible | High (4) | Severe (4) | 16 | Critical |
| R4: Training time is insufficient | Low (2) | Medium (3) | 6 | Low |
| R5: Go-live conflicts with quarter-end close | High (4) | Medium (3) | 12 | High |
Result: Two critical risks (R1 and R3) require immediate action. R5 is high priority. R2 is being monitored and countermeasures are being prepared. R4 remains on the watch list.
Next steps: For R1, ensure a complete backup before the migration and perform a test migration on a staging system. For R3, schedule an early integration test in Sprint 2. For R5, move the go-live date forward by four weeks to avoid the conflict with the quarter-end close.
Advantages of the risk matrix
Visual clarity. The risk matrix condenses complex assessments into a single picture. Where a table of numbers gets skimmed, the color coding sticks in the mind.
Clear prioritization. Limited resources require decisions. The matrix shows which risks deserve immediate attention and which can be monitored.
Common language. The matrix creates a shared understanding within the team and with stakeholders. When everyone looks at the same visualization, fewer misunderstandings arise about the risk situation.
Low barrier to entry. No specialized tools, no complex calculations. A risk matrix can be created with a whiteboard and sticky notes just as easily as in a spreadsheet.
Comparability. Across project boundaries, a standardized risk matrix provides a consistent basis for assessment — particularly valuable in multi-project management.
Limitations of the risk matrix
Subjectivity. The assessment of probability and impact is based on estimates, not exact data. Different teams rate the same risk differently. Clearly defined scales mitigate this problem, but do not eliminate it.
No monetary quantification. The matrix provides relative categories, not absolute values. It says “critical,” but not “€200,000 in potential damage.” For financial decisions, you additionally need a quantitative analysis.
Static snapshot. A risk matrix reflects the state at a specific point in time. Risks change as a project progresses — new ones emerge, existing ones become more or less likely. Without regular updates, the matrix quickly becomes outdated.
Correlations remain invisible. The matrix assesses each risk in isolation. It does not capture that two risks may amplify each other, or that one risk is only triggered by another.
False precision with fine-grained scales. A 5×5 matrix implies precision that is often not achievable in practice. Whether a risk receives a probability of 3 or 4 is frequently a judgment call. Do not confuse granularity with accuracy.
Practical tips
-
Define scales first. Before the assessment, establish what each level concretely means. Without this definition, every discussion becomes a fundamental debate.
-
Assess as a team. Individual estimates are error-prone. The perspectives of subject-matter experts, project management, and stakeholders combine into a more realistic overall picture.
-
Update regularly. Make the risk matrix a fixed part of your status meetings. A living instrument beats a perfect but outdated analysis.
-
Link to the risk register. The matrix visualizes — the risk register documents. Both belong together. The register contains the details: countermeasures, responsible parties, deadlines.
-
Start simple. A simple 3×3 matrix that is kept up to date is better than an elaborate 5×5 matrix that ends up in a drawer. You can always increase complexity as the need grows.
-
Don’t forget opportunities. Uncertainty has two sides. Opportunity management uses the same matrix logic to systematically capture positive potential.
Frequently asked questions
What is a risk matrix in project management?
A risk matrix is a two-dimensional visualization in which risks are classified by probability of occurrence (Y-axis) and impact (X-axis). The resulting color coding — from green through yellow and orange to red — shows at a glance which risks have the highest priority and require immediate action.
How do I create a risk matrix?
In five steps: First, identify all relevant risks. Then define the rating scale (e.g., 5 levels per axis). Next, rate each risk by probability of occurrence and impact, enter the results into the matrix, and derive the appropriate countermeasures based on the position in the color scheme.
What is the difference between a 3×3 and a 5×5 risk matrix?
The 3×3 matrix works with three levels per axis (e.g., low, medium, high) and is suitable for simple projects or initial assessments. The 5×5 matrix offers five levels and enables finer differentiation — useful for more complex projects with many risks.
How often should a risk matrix be updated?
At least at every milestone and in every project status meeting. Risks change as a project progresses: new risks emerge, existing ones become more likely, or lose their relevance. An outdated risk matrix is worse than none — it creates a false sense of security.
Is a risk matrix sufficient as the only tool in risk management?
No. The risk matrix is a visualization tool — it makes assessments visible, but does not replace systematic risk identification or the risk register with detailed countermeasures and responsibilities. In the risk management process, it is one important building block among several.

Senior Advisor
Jörg Friedrich is the original author of the project management software Allegra and continues to accompany its development to this day. He has many years of industry experience as a project and department manager. He also serves as a professor in the Faculty of Computer Science and Information Technology at Esslingen University of Applied Sciences.