
What Is the ABC Analysis?
The ABC analysis is a simple yet powerful method for classifying objects (e.g., customers, projects, processes) according to their importance to business success. Three classes are available:
- Class A — very important
- Class B — important
- Class C — less important
Importance is represented by a key metric that depends on the subject of the analysis. Different methods and strategies can then be applied to each class, allowing a company’s efficiency to be improved in a targeted way. For example, customers can be ranked by revenue, and those in the particularly important A category can receive special service or additional attention.
The method was developed in the 1950s by H. Ford Dickie and is based on the Pareto principle. It states that roughly 20 percent of effort generates about 80 percent of results. Precisely these most relevant 20 percent are assigned to the A category in the classification. This clear structure makes it possible to control and optimize processes in a targeted manner.
Distinction from Similar Methods
The ABC analysis is often compared with other prioritization methods (cf., e.g., SWOT analysis):
- XYZ analysis: Classifies materials or products by the predictability of their consumption, whereas the ABC analysis distinguishes by economic significance.
- Portfolio analysis (e.g., BCG matrix): Evaluates products based on market growth and market share, whereas the ABC analysis considers only one dimension — value contribution.
- Value analysis: Examines products or processes in detail with respect to their economic efficiency, whereas the ABC analysis enables a simplified classification.
- VED analysis: Used in spare-parts management to prioritize parts by criticality, whereas the ABC analysis focuses on economic relevance.
- Eisenhower matrix: Distinguishes between “important” and “urgent,” which can be subjective. The ABC analysis, by contrast, is based on measurable criteria. More on this: Eisenhower matrix.
What Benefits Does the ABC Analysis Offer?
The ABC analysis helps structure different objects by their relative importance and assign them to clearly defined classes. This allows strategies and measures to be tailored precisely to each category. That means:
- Best possible use of resources
- Concentration on the objects with the greatest value creation
- Clearer decisions, based on facts
Using this method can both increase a company’s efficiency and broaden its strategic planning horizon. In addition, the ABC analysis frequently serves as the starting point for optimization and rationalization processes.
Cost savings can be achieved, for example, by directing premium service offerings primarily to the highest-revenue customer group.
ABC Analysis Example
The theory is clear — but what does the ABC analysis look like in practice? Let’s walk through a concrete example so you can see how simple, effective and efficient the method is.
Example: ABC Analysis in Inventory Management
Imagine you run a company that sells 9 different products. Not all products are equally important to your revenue. With the ABC analysis, you can find out which items are most valuable to your business — and which can be given less attention. We therefore use annual revenue as the key metric, and each product as the object.
Step 1: Collect Data
First, analyze the annual revenue of your products:
| Product | Revenue (€) |
|---|---|
| Product A1 | 60,000 |
| Product A2 | 102,000 |
| Product A3 | 10,000 |
| Product B1 | 5,500 |
| Product B2 | 6,000 |
| Product B3 | 8,000 |
| Product C1 | 4,000 |
| Product C2 | 2,000 |
| Product C3 | 1,500 |
| Product C4 | 1,000 |
The cumulative annual revenue for all products (the sum of all revenues across all products) is €200,000.
Step 2: Sort by Revenue
Now arrange the products from highest to lowest revenue and calculate the share of cumulative revenue.
| Product | Revenue (€) | Cumulative % |
|---|---|---|
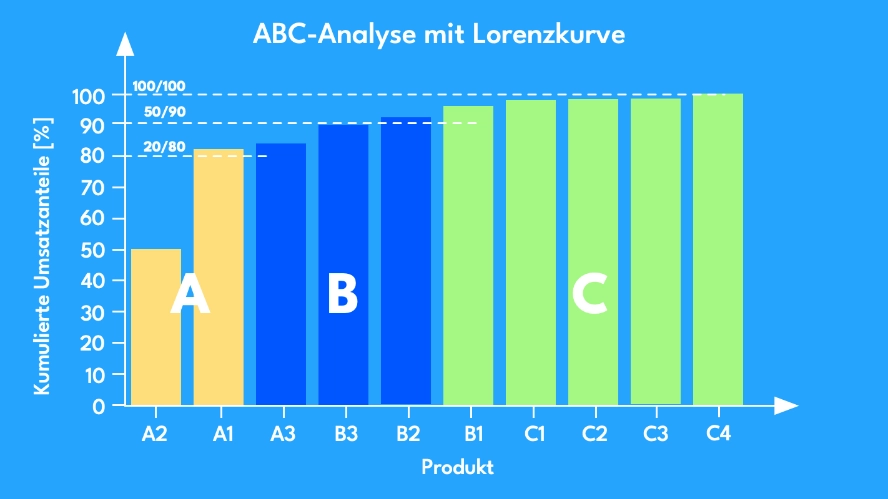
| Product A2 | 102,000 | 51.0 % |
| Product A1 | 60,000 | 81.0 % |
| Product A3 | 10,000 | 86.0 % |
| Product B3 | 8,000 | 90.0 % |
| Product B2 | 6,000 | 93.0 % |
| Product B1 | 5,500 | 96.0 % |
| Product C1 | 4,000 | 98.0 % |
| Product C2 | 2,000 | 99.0 % |
| Product C3 | 1,500 | 99.5 % |
| Product C4 | 1,000 | 100 % |
Step 3: Assign to A, B, and C
- A products: The top 20 % of products (here 2 products), generating 81 % of revenue.
- B products: The middle 30 %, accounting for 15–20 % of revenue.
- C products: The remaining 50 %, contributing only 5 % of revenue combined.
The boundaries here — apart from the first one (80/20) — are chosen more or less arbitrarily.
Step 4: Derive Actions
What does this mean for your company?
- A products: High priority! These products deserve special attention — better warehousing, a stronger marketing strategy, reliable suppliers.
- B products: Average importance. They should be optimized, but not excessively prioritized.
- C products: Low contribution to revenue. It may be worth reducing stock levels here or removing unprofitable products from the range.
Key Metrics for the ABC Analysis
The ABC analysis is based on forming value pairs consisting of the object or subject of the analysis and a key metric for assessing the object’s importance.
Examples of such value pairs include:
- Product and revenue
- Item and inventory
- Customer and revenue
- Project and significance
- Time allocation and urgency
Revenue or Revenue Share
Both absolute revenue and revenue share are suitable key metrics for the ABC analysis. Revenue share of a product or customer is particularly relevant in sales or purchasing. The formula:
Revenue share = (revenue of one object / total revenue) × 100
Example: A product with €50,000 in revenue against a total revenue of €200,000 has a share of 25 %.
Revenue share as a metric simplifies comparability over longer periods compared to absolute revenue figures.
Costs or Cost Share (%)
Costs or cost share as metrics are useful in financial and inventory management. The focus here is on which line items incur the highest costs.
Cost share = (cost of one element / total costs) × 100
Cost share as a metric simplifies comparability over longer periods compared to absolute cost figures.
Inventory
Inventory as a key metric is especially helpful in logistics and warehousing. Items with high inventory levels and low turnover rates may be so-called “shelf warmers” and should be cleared more quickly, for example through discount campaigns.
Contribution Margin
Contribution margin as a key metric is particularly useful in purchasing. It answers the question of which products or services generate the most profit.
Significance
In the context of allocating resources to projects, the strategic or economic significance of the projects can serve as a good measure of their importance. The significance of a project can be represented, for example, by the expected revenue over the next five years.
Urgency
Urgency as a key metric when allocating working time to specific tasks or other activities helps you focus on what matters most and defer or drop less urgent activities.
Application Areas of the ABC Analysis
The ABC analysis is versatile and by no means limited to business processes. It can be applied in almost every area of a company — from project management and time management to purchasing, sales, and human resources.
Below we look at the most important application areas and explain how the ABC analysis can be put to practical use in day-to-day work.
| Application area | Object | Key metric |
|---|---|---|
| Project management | Project tasks | Importance directly (A,B,C) |
| Time management | Tasks | Importance directly (A,B,C) |
| Supplier management | Supplier | Revenue |
| Inventory and warehouse management | Product | Inventory |
| Purchasing and procurement | Material/service | Costs |
| Customer management | Customer | Revenue |
| HR management | Employee | Importance (directly A,B,C) |
| Financial management | Cost center | Expenditure |
Project Management: Setting the Right Priorities
Too many tasks, too little time — a familiar problem in project management. The ABC analysis helps you focus on the truly important tasks:
- A category: Critical tasks that determine success or failure.
- B category: Necessary but less central tasks.
- C category: Activities that can be delegated, automated, or reduced.
Example: In an IT project, software development is an A task, while documentation and internal meetings tend to fall into the B category. Weekly status update emails? C category — perhaps dispensable. The ABC analysis thus creates clear priorities and prevents wasted time.
Time Management: Achieve More with Less Effort
Not every task deserves the same attention. The ABC analysis helps structure your day more efficiently (cf. time management):
- A tasks: Activities with a direct impact on your goals.
- B tasks: Important but less impactful activities.
- C tasks: Low-value tasks that consume time.
Example: A sales manager spends hours each day on email (C category) instead of focusing on high-revenue customers (A category). The solution? Set time limits for email and set priorities.
The ABC method helps in this case to make the working day more effective and reduce distractions.
Supplier Management: Identifying the Most Important Partners
Not all suppliers have the same value for your company. An ABC analysis helps you recognize the strategically most important ones:
- A suppliers: Critical to business operations, difficult to replace.
- B suppliers: Important but replaceable.
- C suppliers: Low significance, low volumes.
Example: An automotive manufacturer recognizes that just 10 % of suppliers account for 90 % of production. These partners require special contracts and long-term cooperation agreements.
The ABC analysis thus helps you secure the stability of your most important supply chains.
Inventory and Warehouse Management: Reduce Costs, Increase Efficiency
An overstocked warehouse costs money. The ABC analysis helps optimize inventory levels:
- A products: High demand — must always be available.
- B products: Medium significance — optimize stock levels.
- C products: Low demand — possibly remove from the range.
Example: An online shop reduces its warehousing costs by 30 % after recognizing that 70 % of its storage space is occupied by products with low demand.
The ABC analysis thus avoids unnecessary capital tied up in inventory.
Purchasing and Procurement: Making Strategic Decisions
Not every purchase is equally important. The ABC analysis helps prioritize purchasing decisions:
- A category: Critical materials or services.
- B category: Important, but not business-critical.
- C category: Low-value or rarely needed procurement items.
Example: A manufacturing company finds that 80 % of its purchasing budget is spent on just 20 % of materials — these require particular attention.
In this case, the ABC method helps deploy budgets efficiently.
Customer Management and Sales: Focusing on the Right Customers
Not every customer is equally valuable. The ABC analysis helps deploy sales resources sensibly:
- A customers: Major or loyal customers with high revenue.
- B customers: Important but lower-revenue customers.
- C customers: Customers with low purchase volumes or high support requirements.
Example: A software company recognizes that 15 % of its customers account for 85 % of revenue. These customers receive preferential support, while C customers receive only basic support.
The ABC method helps align sales strategies in a targeted way.
Financial Management: Identifying the Biggest Cost Drivers
Not every expenditure is necessary. The ABC analysis shows where savings can be made:
Example: A cost analysis reveals that just 15 % of cost centers are responsible for 80 % of expenditure — targeted reduction of these costs can deliver substantial savings.
The ABC method offers a structured approach to identifying and reducing unnecessary costs.
HR Management: Developing the Most Important Employees in a Targeted Way
Every company has key people who are particularly valuable. The ABC analysis helps develop talent strategically:
- A employees: Highly qualified experts in key roles.
- B employees: Important specialists with moderate influence.
- C employees: Employees with limited strategic significance.
Example: An IT company invests specifically in training for its top developers (A category), as they have the greatest impact on innovation and revenue.
The ABC analysis helps deploy HR resources where they deliver the greatest added value.
The ABC Analysis as a Versatile Tool
Whether in project management, sales, or purchasing — the ABC analysis helps deploy resources in a targeted way and make better decisions. It creates clear priorities, reduces unnecessary costs, and increases efficiency in almost every area of a company.
What Are the Advantages and Challenges?
The ABC analysis is one of the simplest and most effective methods for setting priorities. Like every method, it has advantages, but also challenges you should be aware of.
The Advantages of the ABC Analysis
1. Easy to implement The method is easy to understand and can be applied in almost any area — from project management to warehouse management. Project management tools often support ABC categorization directly. All you need is data and a clear prioritization.
2. Clear focus on what matters The ABC analysis helps identify the most important 20 % of elements that deliver the greatest success. This saves time, money, and resources.
3. Better resource utilization Through categorization, you immediately recognize where investments are worthwhile and where you can save. This is an enormous advantage especially in budget and time planning.
4. Data-driven decisions instead of gut feeling Many prioritizations are subjective. The ABC analysis uses hard numbers to make objective, well-founded decisions.
5. Flexible application Whether customer management, purchasing, time management, or quality control — the ABC method can be applied everywhere.
The Challenges of the ABC Analysis
1. Data availability and quality The ABC analysis is based on numbers. If good data is not available (e.g., incomplete revenue reports or inaccurate time tracking), the results can be distorted.
Solution: Use figures from multiple sources to obtain the most precise values possible.
2. Defining threshold values The classic 80/20 rule is a guideline, but not always an exact fit. In some cases, the most important elements are 10 % or 30 %, not 20 %.
Solution: Test different threshold values to find the best classification for your situation.
3. Neglect of the B and C categories Many companies focus exclusively on the A category after conducting an ABC analysis. Yet B and C elements also serve a purpose and may become more important in the future.
Solution: Focus on optimization rather than elimination. C products might be automated or simplified rather than discontinued entirely.
4. Lack of consideration for qualitative factors Not everything can be assessed purely quantitatively. Some customers or projects have strategic value even if they currently generate little revenue.
Solution: Supplement the ABC analysis with qualitative assessments to account for long-term factors.
More Benefits than Drawbacks
Despite some challenges, the advantages of the ABC analysis clearly outweigh them. The method brings more structure, better decisions, and more efficient use of resources.
Summary
The ABC analysis is a business management instrument used to systematically organize and evaluate company areas, resources, or objects with respect to their significance. It is applied in numerous functional fields, including procurement, logistics, materials management, and customer classification.
Within this method, products, goods, or other objects under consideration are divided into three priority levels:
-
A category: particularly high relevance
-
B category: medium significance
-
C category: relatively low importance
Based on this classification, specific measures and approaches can be developed for each group.
Beyond classic business areas, the ABC analysis is also used in human resources as an evaluation approach, in project and product management, as well as in task and time management. Particularly for structuring workflows, it provides a helpful orientation for setting priorities clearly and making processes more transparent.
Like any analytical method, the ABC analysis has both advantages and disadvantages. Because it often works with only a few criteria, complex relationships can sometimes only be mapped in a limited way. At the same time, however, it helps companies improve processes, deploy resources more effectively, and increase cost efficiency.
Frequently Asked Questions
What is the ABC analysis?
The ABC analysis is a method for prioritizing and classifying objects, tasks, or processes by their economic significance. It is based on the Pareto principle and divides elements into three categories: A (very important), B (moderately important), and C (less important).
How does the ABC analysis work?
The ABC analysis works through a systematic classification of elements based on their value contribution. Data is first collected, then sorted by economic significance, and finally divided into three groups. A elements have the greatest impact, B elements have moderate significance, and C elements have the least influence.
Where is the ABC analysis used?
The ABC analysis is used in many areas, including warehousing, purchasing, customer management, project and time management, and cost control. It helps companies deploy their resources in a targeted way and make efficient decisions.
What are the advantages of the ABC analysis?
The ABC analysis offers several advantages: it enables better resource utilization, supports data-driven decisions, helps prioritize important tasks, and contributes to cost reduction. It is also easy to apply and versatile in use.
What are the disadvantages of the ABC analysis?
One disadvantage of the ABC analysis is that it offers only a one-dimensional view and does not take qualitative factors into account. It can also lose its explanatory power quickly in dynamic environments if market or business conditions change.

Senior Advisor
Jörg Friedrich is the original author of the project management software Allegra and continues to accompany its development to this day. He has many years of industry experience as a project and department manager. He also serves as a professor in the Faculty of Computer Science and Information Technology at Esslingen University of Applied Sciences.