Summary
The critical path is the longest chain of dependent activities in a project. It determines the minimum duration of the entire project. Activities on the critical path have zero buffer time — any delay there delays the entire project. The Critical Path Method (CPM) calculates the critical path through a forward pass and backward pass in the network diagram. This article explains the method step by step and illustrates it with a complete practical example.
What is the critical path?
In every project there are tasks that must be completed before others can begin. The foundation before the walls. The walls before the roof. These dependencies form chains — and the longest of these chains determines the minimum duration of the entire project. That longest chain is the critical path.
The term comes from the Critical Path Method (CPM), developed in 1957 by Morgan Walker (DuPont) and James Kelley (Remington Rand). Their goal was to minimize downtime in chemical production plants. Today, CPM is one of the fundamental project management methods and is used across industries.
What makes the critical path distinctive: the activities on it have a buffer time of zero. There is no slack. If an activity on the critical path takes one day longer than planned, the project end date shifts by exactly that one day. All other activities — those not on the critical path — have buffer time that can absorb certain delays without jeopardizing the overall project.
CPM and PERT — a brief distinction
Almost simultaneously with CPM, the U.S. Navy developed the Program Evaluation and Review Technique (PERT) for the Polaris missile program. Both methods use network diagrams and identify the critical path. The difference: CPM uses fixed duration estimates for each activity, while PERT works with three estimates (optimistic, most likely, pessimistic) and calculates a weighted expected value from them. In practice, CPM is the more commonly used method.
Why is the critical path important?
The critical path is not an academic construct. It is one of the most effective tools in scheduling and provides answers to central questions in project management:
It determines the minimum project duration. No project can be completed faster than the length of its critical path — unless you change the dependencies or shorten individual activities.
It shows where delays are critical. Not every delay threatens a project. A task with three days of buffer can finish three days late without any consequences. A task on the critical path cannot.
It enables targeted resource allocation. When you know which activities are critical, you can deploy your best people and your scarcest resources exactly where they have the greatest influence on the project deadline.
It identifies buffer time. Calculating the critical path produces, as a byproduct, the buffer times of all non-critical activities. These buffers are valuable information for detailed planning and risk management.
It is an early warning system. When an activity on the critical path falls behind schedule, you know immediately: the project is at risk. This clarity enables a fast response.
Calculating the critical path — step by step
The critical path is calculated in four steps. The method assumes you know your project’s activities, their durations, and their dependencies — ideally based on a work breakdown structure (WBS).
1. Define activities and dependencies
List all project activities and define for each one:
- The estimated duration
- The predecessors — that is, the activities that must be completed before this one can begin
The result is an activity list that can be represented as a network diagram.
2. Forward pass
The forward pass determines for each activity the earliest start (ES) and the earliest finish (EF):
- ES = maximum of the earliest finish times of all predecessors
- EF = ES + duration
You start at the first activity (ES = 0) and work forward through the network diagram. The earliest finish of the last activity gives the minimum project duration.
3. Backward pass
The backward pass determines for each activity the latest finish (LF) and the latest start (LS):
- LF = minimum of the latest start times of all successors
- LS = LF − duration
You start at the last activity (LF = project duration) and work backward through the network diagram.
4. Calculate buffer time and identify the critical path
The total float (TF) of an activity is:
TF = LS − ES (or equivalently: LF − EF)
All activities with a float of zero lie on the critical path. Connecting these activities produces the longest path through the network diagram — the critical path.
Example: The critical path in an IT project
A team is planning the development of a web application. The project comprises eight activities:
| Activity | Description | Duration (days) | Predecessors | |---|---|---|---| | A | Requirements analysis | 5 | – | | B | UI design | 8 | A | | C | Database design | 4 | A | | D | Backend development | 10 | C | | E | Frontend development | 12 | B | | F | API integration | 6 | C, D | | G | System testing | 5 | E, F | | H | Deployment and go-live | 3 | G |
Forward pass
| Activity | Duration | ES | EF | |---|---|---|---| | A | 5 | 0 | 5 | | B | 8 | 5 | 13 | | C | 4 | 5 | 9 | | D | 10 | 9 | 19 | | E | 12 | 13 | 25 | | F | 6 | 19 | 25 | | G | 5 | 25 | 30 | | H | 3 | 30 | 33 |
The minimum project duration is 33 days.
Backward pass
| Activity | Duration | LS | LF | Float (TF) | |---|---|---|---|---| | A | 5 | 0 | 5 | 0 | | B | 8 | 5 | 13 | 0 | | C | 4 | 5 | 9 | 0 | | D | 10 | 9 | 19 | 0 | | E | 12 | 13 | 25 | 0 | | F | 6 | 19 | 25 | 0 | | G | 5 | 25 | 30 | 0 | | H | 3 | 30 | 33 | 0 |
Result
In this example there are two paths through the network diagram:
- Path 1: A → B → E → G → H = 5 + 8 + 12 + 5 + 3 = 33 days
- Path 2: A → C → D → F → G → H = 5 + 4 + 10 + 6 + 5 + 3 = 33 days
Both paths are equal in length — in this case, both paths are critical. This means any delay on either path extends the project. A situation that requires special attention in project controlling.

The critical path in a Gantt chart
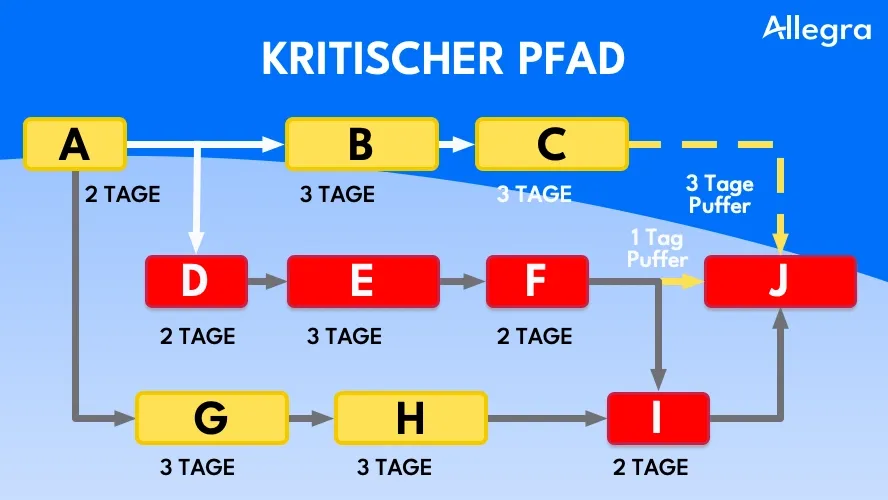
In a Gantt chart, the critical path is typically shown through bars colored in red. Non-critical activities remain in the standard color, and their buffer times are often displayed as a thin extension of the bar.
This visualization makes it immediately clear at a glance which tasks determine the project deadline and where there is slack. Most modern project management tools — from Microsoft Project to web-based solutions — can calculate the critical path automatically and highlight it in the Gantt chart.
Note: the critical path can change over the course of a project. When a non-critical activity exhausts its buffer time, it can itself become critical. Regular recalculations are therefore advisable.
Critical path and network diagram technique
The Critical Path Method is inseparable from network diagram technique. The network diagram provides the graphical foundation: it represents activities as nodes and dependencies as arrows. The CPM calculation provides the time values entered into each node.
In practice, two network diagram representations are distinguished:
- Activity-on-node (AON): activities are shown as boxes, arrows indicate dependencies. This is the most common form used today.
- Activity-on-arrow (AOA): activities are shown as arrows, nodes represent events. This representation is used less frequently.
For calculating the critical path, the representation format is irrelevant — the result is the same.
Advantages and limitations of the Critical Path Method
Advantages
- Clarity: CPM answers the most important question in scheduling: what is the minimum project duration?
- Prioritization: project managers know exactly which activities deserve special attention.
- Early warning system: delays on the critical path are immediately recognized as project-threatening.
- Buffer information: the method produces, as a byproduct, the buffer times of all activities — valuable information for detailed planning and resource management.
- Communication: the critical path provides a clear, understandable basis for conversations with stakeholders and clients.
Limitations
- Static model: CPM assumes that durations are fixed and do not change. In reality, they fluctuate.
- No resource conflicts: the method does not account for whether the same person is scheduled for two parallel activities. Resource conflicts must be resolved separately.
- Estimation accuracy: the quality of the result depends entirely on the quality of the duration estimates. Poor estimates lead to an incorrect critical path.
- Complexity with large projects: for projects with hundreds of activities, manual calculation becomes impractical. Software tools are indispensable here.
Critical Chain Project Management (CCPM) — developed by Eliyahu Goldratt — addresses some of these weaknesses. It accounts for resource conflicts and uses buffers at the end of the project rather than at each individual activity. CCPM can be understood as an evolution of the classic CPM approach.
Practical tips
-
Calculate the critical path early. Even during project planning, the critical path delivers valuable insights into whether the desired end date is realistic.
-
Update regularly. The critical path is not a one-time calculation. It changes as activities are completed faster or slower than planned. Integrate recalculation into your regular status reviews.
-
Protect the critical path. Assign your most experienced team members to critical activities. Avoid burdening people on the critical path with additional tasks.
-
Be aware of fast-tracking and crashing. When the critical path is too long, there are two acceleration strategies: fast-tracking parallelizes activities that were originally planned sequentially. Crashing adds additional resources to shorten individual activities. Both strategies carry risks and costs.
-
Don’t overlook near-critical paths. A path with only one day of float can become the new critical path through a small delay. Keep these paths in view as well.
Frequently asked questions
The critical path is the longest route through a project plan — that is, the sequence of activities that determines the minimum duration of the project. Put differently: the critical path is the chain of tasks that have no buffer time.
The calculation follows four steps: 1. List activities and dependencies, 2. Forward pass (earliest start and finish times), 3. Backward pass (latest start and finish times), 4. Calculate float. All activities with zero float lie on the critical path.
Any delay on the critical path extends the entire project duration by exactly that amount of time. This is why critical activities require special attention and should be prioritized.
Yes. When non-critical activities exhaust their buffer time or critical activities are completed faster than planned, the critical path can shift. Regular recalculations are therefore recommended.
Both methods identify the critical path in the network diagram. CPM uses fixed duration estimates for each activity. PERT works with three estimates (optimistic, most likely, pessimistic) and calculates a weighted expected value from them. CPM is better suited for projects with experience-based estimates; PERT for projects with high uncertainty.

Senior Advisor
Jörg Friedrich is the original author of the project management software Allegra and continues to accompany its development to this day. He has many years of industry experience as a project and department manager. He also serves as a professor in the Faculty of Computer Science and Information Technology at Esslingen University of Applied Sciences.