What Is a Gantt Chart?
The Gantt chart is named after the system for controlling work performance invented by Henry Laurence Gantt around 1900. It represents the project schedule of a project using bars over a timeline. This diagram is therefore also called a bar chart or bar plan. It differs from a timeline diagram in that it also shows the dependencies between activities. Gantt charts are among the most effective project management methods.
A Gantt chart documents both the actual and planned content and timing of a project. It presents the scheduling elements — i.e., activities and milestones — taking into account their relationships, constraints, and dependencies, with clearly displayed start dates, durations, and end dates.
The basis for a Gantt chart is usually a work breakdown structure (WBS). However, the WBS can also be created directly within the Gantt chart as a Work Breakdown Structure. No information or clarity is lost in the process. The activities in the Gantt chart are derived from the sub-projects, sub-tasks, and work packages of the WBS.
Gantt Chart Structure: The Most Important Elements at a Glance
Projects: The Time Frame at a Glance
A core feature of the Gantt view is the ability to arrange elements hierarchically. The top levels contain the projects and sub-projects. These break down into subordinate activities or deliverables. For example, a classic project might have activities for individual phases such as Planning and Implementation. In an agile project, the Gantt chart would be divided into release and Sprint activities below the project level.
The expected time frame of a project is determined by the start and end dates of the activities it contains.
Track project schedules with Allegra
Activities: Duration, Start Date, and End Date
Activities group together units of work such as work packages (tasks). Activities must be further subdivisible into sub-activities to any depth. It is often helpful to use the results (deliverables) produced by activities rather than the activities themselves. The advantage is that it is easier to verify whether a deliverable is truly complete than to determine whether enough work has been done.
Activities typically have a start date, a duration, and an end date. In some tools, the current progress is shown by coloring the activity bar.
Duration can be calculated in calendar days or working days, depending on how duration is defined.
- Calendar days: All days are counted, including weekends and public holidays.
- Working days: Only weekdays are counted — days on which work actually takes place (excluding weekends and public holidays).
Duration and Effort: Often Confused
In project management, “duration” and “effort” refer to two different concepts:
-
Duration: Duration refers to the length of time required to complete a specific task or project from start to finish. It indicates how long it takes in total for an activity to be completed, regardless of how many resources or people are involved. For example, a task may have a duration of 5 days, even if only a few hours per day are actually spent on it.
-
Effort: Effort, on the other hand, describes the amount of work required to complete a task. It is often measured in person-hours or person-days. Effort accounts for how much labor (e.g., the number of hours a team member works on a task) is needed. A task may, for example, require 40 hours of effort, regardless of whether those hours are spread over 5 days or 2 weeks.
In short: duration refers to the calendar time span, while effort refers to the actual working time that must be invested.
Activity Duration and the Critical Path
The duration of activities and work packages determines the bar length. Bars for individual tasks may overlap in the Gantt chart. It is advisable to plan buffer times between individual activities.
If tasks affect the project end date and there are no buffer times between them, they lie on the critical path. Any delay on the critical path will always result in a delay to the project end date. You may already be familiar with this concept from working with network diagrams.
Milestones: The Key Moments in a Project
Milestones mark the completion of a phase or stage in the project. They therefore represent goals that have already been reached in the project or that are yet to be achieved. Milestones are indicated in the Gantt chart by a diamond shape. In many tools, activities with a duration of zero are interpreted as milestones.
In some projects there are milestones that arise from higher-level constraints outside the project’s control — such as a trade fair date. Such milestones must not be moved. Good Gantt tools therefore offer the ability to protect certain activities, and milestones in particular, against schedule changes.
How to create milestones in the Allegra Gantt chart
Pay Attention to the Critical Path
The duration of activities and work packages determines the bar length. Bars for individual tasks may overlap in the Gantt chart. It is advisable to plan buffer times between individual activities. If tasks affect the project end date and there are no buffer times between them, they lie on the critical path. Any delay on the critical path will always result in a delay to the project end date. You may already be familiar with this concept from working with network diagram techniques.
Who Are Gantt Charts Suitable For?
Gantt charts are suitable for a wide range of audiences in project management, particularly for those who need a clear, visual representation of tasks, schedules, and dependencies. They are especially useful for:
-
Project managers:
- Gantt charts help project managers plan complex projects, monitor progress, and manage resources. They provide an overview of which tasks need to be completed when and which dependencies exist. They are also easy to understand for non-specialists and can be used as a central control tool in kick-off meetings and subsequent standing meetings.
-
Project teams:
- For team members, Gantt charts provide a clear view of their tasks, deadlines, and dependencies. This helps them better prioritize and coordinate their own work.
-
Stakeholders:
- Stakeholders such as clients, executives, or investors benefit from Gantt charts because they provide a clear and visual overview of project progress. They allow stakeholders to see at a glance whether the project is on schedule.
-
Resource planners:
- People responsible for allocating and managing resources (staff, equipment, etc.) can use Gantt charts to plan resource usage over time and identify bottlenecks.
-
Executives:
- For executives, a Gantt chart offers an easy way to get an overview of a project’s status and ensure it stays on track, without having to dive into too many details.
Gantt Charts Are Particularly Well Suited For:
- Medium to large projects: They make it possible to visualize many tasks and dependencies.
- Projects with clearly defined deadlines: When it is important to keep track of dates and milestones, Gantt charts are a valuable aid in project controlling.
- Projects involving multiple teams or departments: To see how different work packages relate to each other over time.
Gantt Charts Are Less Suitable For:
-
- Very small projects or projects without clear deadlines: Here the effort of creating a Gantt chart may outweigh the benefit.
- Agile or flexible projects: Agile project management, which relies on rapid adaptation, often prefers other methods such as Kanban boards, since Gantt charts are less flexible in responding to changes.
Advantages of the Gantt Chart
- The Gantt view is quickly understood even by non-specialists
- The Gantt chart provides a quick overview of project activities
- The duration of activities is easy to see from the bar length
- Relationships between activities are easy to recognize from the connecting lines
- The current status of the project is easy to grasp at a glance
- Buffer times can be identified easily
- Critical activities and workflows can be identified
Dependencies in the Gantt Chart
It is typical for projects that some of the tasks to be completed are dependent on one another. The two main types of dependencies are:
- Dependencies via shared resources
- Logical dependencies
Some activities can only begin once others have ended, or they may depend on the start of another activity, for example.
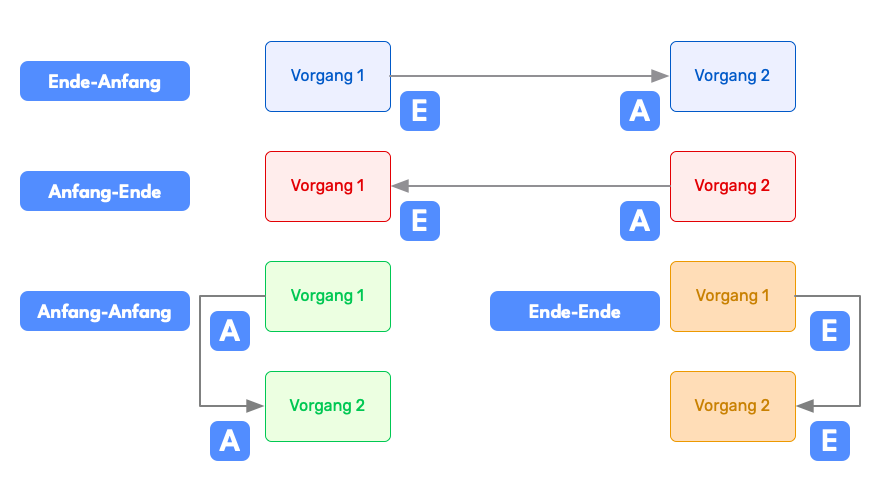
These linearly sequential relationships must be entered into the bar chart. In the Gantt chart there are four different relationship types for this purpose:
Finish-to-Start
A task can only start once a preceding one has ended. This is the most common case. Example: The roof frame can only be erected after the top floor has been bricked and the ceiling of the top floor has been built.
Finish-to-Finish
A task can only end once a preceding one has ended. Example: A building acceptance process can only be completed once all other tasks have also been finished. It may, however, already be started while other activities are still open.
Start-to-Start
This type of dependency means that the successor task can only begin once the predecessor task has also begun. For example, if you are preparing a table for your guests, you can start preparing the side dish as soon as you have put the main course in the oven to roast.
Start-to-Finish
A task can only end once a preceding one has started. This is a rare configuration in practice and is best suited for handover processes. If, for example, you work in shifts at a gas station, you cannot finish your work and go home before your colleague who covers the next shift arrives and takes over.
For a short project duration, it is advantageous for as many tasks as possible to be able to run in parallel. In this case, it is then a question of the available resources how long it takes to complete a project.
Once dependencies have been defined, modern project management tools can take them into account when dates are shifted. If an activity is moved, all dependent activities are shifted accordingly as well, unless they have previously been marked as fixed, immovable tasks.
Creating a Gantt Chart: Excel or Project Management Software?
Gantt charts are no longer created on paper today but with the help of appropriate software. There are many project managers who are familiar with Excel and use it to create simple Gantt charts. However, a good project management tool offers important capabilities that Excel-based representations and simple tools cannot provide. These include:
- Only a flat timeline with limited hierarchy
- Access control only at the global project or file level
- No history or traceability of changes
- Not team-capable — only the project manager can edit the plan
A modern Gantt tool offers these capabilities and should be the standard as soon as the scope goes beyond small projects.
Alternatives to the Gantt Chart
There are several alternatives to the Gantt chart that can be well suited to various project management styles and requirements. Here are some of the most common alternatives:
1. Kanban Boards:
- Description: Kanban boards are a visual method for managing tasks, where tasks are divided into columns that show their progress (e.g., “To do”, “In progress”, “Done”).
- Suitability: Ideal for agile projects and teams working in continuous workflows. It is particularly helpful for visualizing the flow of work and identifying bottlenecks.
- Tools: Allegra, Asana, Jira, Trello.
2. PERT Diagram (Program Evaluation and Review Technique):
- Description: A network diagram that represents tasks as nodes and visualizes their dependencies through arrows. It is used to analyze the time planning of projects and to identify critical paths.
- Suitability: Useful for very complex projects with many dependencies and uncertain time estimates. It enables more precise planning when there is uncertainty about the duration of tasks.
- Tools: Microsoft Project, Lucidchart.
3. Network Diagram Technique (Critical Path Method, CPM):
- Description: Similar to the PERT diagram, the network diagram technique focuses on the critical tasks in the project that directly affect project completion.
- Suitability: For projects where critical paths and dependencies are the primary concern. It helps identify tasks that must be completed on time to avoid delays.
- Tools: ProjectLibre, GanttProject.
4. Roadmaps:
- Description: A high-level representation of the key phases, milestones, and objectives of a project. It does not show detailed tasks, but rather long-term goals and time frames.
- Suitability: Ideal for strategic planning and for stakeholders who need an overview of key milestones and goals.
- Tools: Aha!, Monday.com, Roadmunk.
5. Burndown Charts:
- Description: A chart that shows the remaining workload compared to the remaining time. It shows how much work is still to be done and whether the team is on track.
- Suitability: Perfect for agile projects, especially in Scrum teams. It helps monitor progress within a Sprint or iteration.
- Tools: Allegra, Easy Agile, Jira, ScrumDo.
6. Task Lists (To-Do Lists):
- Description: Simple lists of tasks that need to be completed. They provide a clear, unstructured overview of what needs to be done.
- Suitability: Ideal for smaller projects or personal task management, where no complex dependencies or detailed schedules are required.
- Tools: Todoist, Microsoft To Do, Wunderlist.
7. Mind Maps:
- Description: A visual representation of ideas, tasks, and concepts that branch out from a central topic.
- Suitability: Useful for brainstorming sessions and for organizing thoughts in the early planning phase of a project.
- Tools: XMind, MindMeister, Coggle.
Frequently Asked Questions
What is a Gantt chart, explained simply?
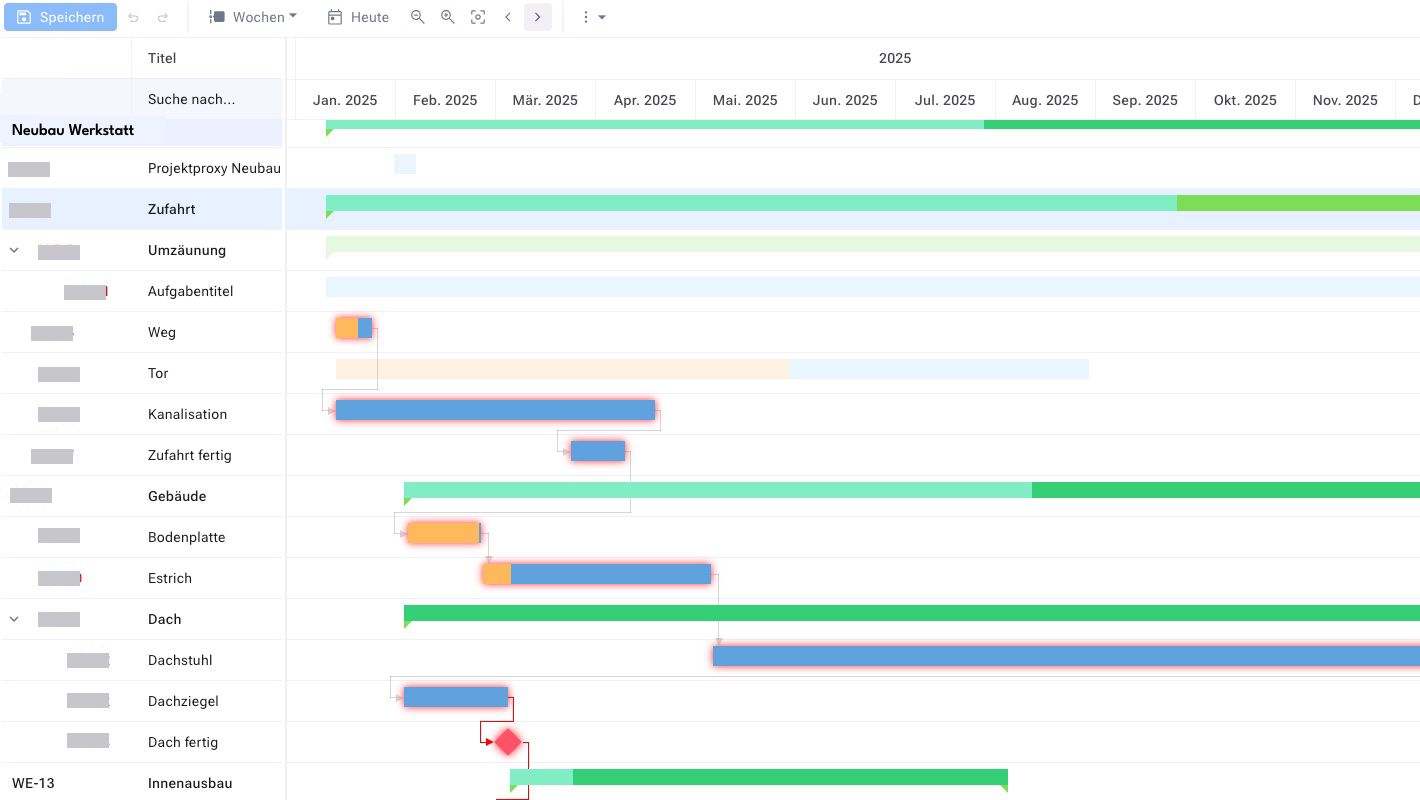
A Gantt chart is a visual representation of a project schedule, in which tasks are shown as bars on a timeline. It displays the start and end of each task, as well as its duration and overlaps, making it easy to identify project phases and dependencies.
How do I create a Gantt chart?
You create a Gantt chart in 6 steps: 1. Define the project and its tasks. 2. Determine the timeline and working duration for each task. 3. Assign resources. 4. Create the time bars in the chart. 5. Adjust the sequence and overlaps. 6. Monitor and update the chart regularly.
How do I create a Gantt chart in Excel?
To create a Gantt chart in Excel, open a new Excel worksheet, enter your project information, and convert it into a bar chart. Adjust the bars to reflect start and end dates, and format the timeline for a clear presentation. This lets you effectively visualize project schedules.
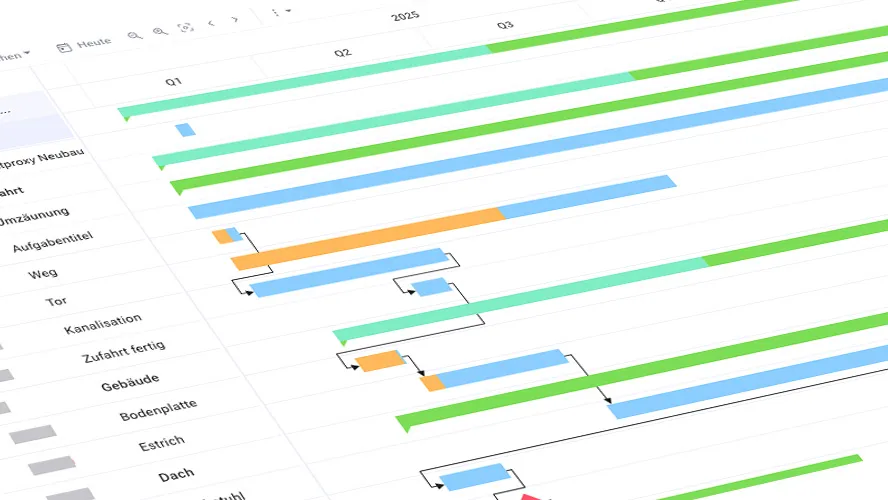
What does a Gantt chart look like?
A Gantt chart is a visual representation of project schedules, consisting of a vertical list of project activities, a horizontal timeline, and bars that represent the duration and status of each activity. Arrows indicate dependencies between tasks, which helps with project planning and monitoring.
What alternatives are there to the Gantt chart?
In addition to the Gantt chart, network diagram techniques, milestone planning, the critical chain method, and agile Sprint planning are among the most important scheduling methods. The choice depends on project size, complexity, and planning uncertainty — in practice, several methods are often combined.

CEO Alltena GmbH
Christoph Friedrich is a computer scientist and certified Project Management Professional. He has extensive experience in the introduction and integration of project management tools as well as the analysis and definition of processes in project and service management.