What Is Project Controlling?
Project controlling encompasses all activities needed to steer a project throughout its entire lifecycle. The word “controlling” is often equated with “checking” or “oversight” — but that falls short. The English verb “to control” means, above all, to steer, to guide, to regulate. Verification is one component, but far from the whole picture.
A helpful analogy: a modern car has an onboard computer that captures hundreds of parameters — engine speed, oil temperature, tire pressure, brake wear. The driver sees only the essential ones: speed, rev counter, fuel level. If the dashboard displayed every data point at once, the driver would be overwhelmed and the accident risk would rise. Project controlling works the same way: it filters the multitude of project-relevant data down to the project KPIs that are actually needed for steering.
Project controlling is not a separate part of the project — it accompanies all project phases, from planning through execution to closure. It provides project leadership with the data needed to make well-founded decisions.
Distinction from project management: While project management plans, organizes, and executes the project, project controlling focuses on making the project’s progress transparent and surfacing deviations early. In practice the two are closely intertwined — in smaller projects the project manager handles controlling personally; in larger organizations there are dedicated project controllers.
Tasks of Project Controlling
The tasks of project controlling can be structured along the three target dimensions of project management — schedule, cost, and scope (the so-called project management triangle):
- Creating target-actual comparisons: Planned values for schedule, cost, and scope are compared regularly with actual values.
- Identifying and analyzing variances: Where does the project deviate from the plan? Why? Is it a one-time or a systematic deviation?
- Developing forecasts: Based on progress to date, projections are created — for example the estimated cost to complete or the remaining project duration (time to complete).
- Proposing corrective measures: Controlling proposes countermeasures when variances threaten the project objectives.
- Building and maintaining reporting: Regular status reports make the project’s status transparent to all stakeholders.
- Providing decision support: Project leadership and the steering committee receive the basis for deciding on course corrections, budget supplements, or schedule shifts.
Project controlling is therefore the navigation system for project leadership — it shows where the project stands, where it is heading, and where intervention is needed.
Prerequisites for Successful Project Controlling
Project controlling only works when certain conditions are in place. Even the best methodology is of little use without the right foundation.
Clear, measurable objective planning. If you do not know where you are going, you cannot tell whether you are on the right track. Project objectives must be formulated according to SMART criteria — specific, measurable, achievable, relevant, and time-bound. This applies not only to the overall goal but also to milestones and work packages.
Planning structures that match the measurement approach. The way things are planned must match the way they are later measured. If project costs are not recorded at the project level, controlling cannot compare them against the plan. When in doubt, it helps to set up separate cost centers for each project.
Timely data collection. Controlling data that only becomes available weeks after the reference date is worthless for steering. Actual data must be collected promptly and made available to project leadership — ideally in real time via a project management tool, but at a minimum weekly.
Honesty and openness. Project controlling depends on realistic data. If team members conceal problems or overstate progress, even the best tools become blind. Project leadership must foster a culture in which bad news is welcome — because the earlier a problem is identified, the less costly the fix.
Error culture. Deviations are normal in projects — by definition, projects are unique, complex endeavors. What matters is not that no mistakes happen, but that they are recognized, analyzed, and documented for future projects.
The Controlling Cycle
The heart of project controlling is the controlling cycle — a continuous management process that repeats throughout the entire project lifecycle. It consists of seven steps:
-
Goal setting: The starting point is the question: what exactly should be achieved? Clear objectives formulated according to SMART criteria form the foundation for everything that follows.
-
Planning: Concrete work packages, schedules, resources, and budgets are derived from the objectives. The project plan defines the target values against which performance will later be measured.
-
Data collection: As the project progresses, actual data is collected — real costs incurred, time spent, results achieved. This step must occur regularly and promptly.
-
Target-actual comparison: The collected actual data is placed alongside the planned target data. Important: at this stage you are only comparing, not yet evaluating. Jumping to conclusions leads to the wrong measures.
-
Variance analysis: Now the question is why variances have occurred. Three cases must be distinguished: Is the variance negligible (insignificantly small)? Is it a singular deviation caused by a one-time event? Or is there a systematic deviation — for example, a consistently underestimated cost rate running through all work packages?
-
Defining measures: Based on the analysis, corrective actions are defined. Systematic variances may call for a plan adjustment; singular ones warrant a targeted intervention. If the measures require changes to scope, budget, or schedule, change management kicks in.
-
Effectiveness check: Did the measures work? This often-neglected step is critical — because when resources are already tight, further setbacks can permanently endanger the project.
After the effectiveness check, the cycle starts over: objectives are adjusted, planning is updated, new actual data is collected.
Two typical errors keep recurring in practice: first, measures are defined without a thorough analysis of the deviation — experienced project managers reach too quickly for tried-and-tested recipes that do not fit the current situation. Second, the effectiveness check is skipped — measures are initiated and ticked off as done without verifying whether they actually had the desired effect.
The Most Important Tools of Project Controlling
Target-Actual Comparison
The target-actual comparison is the foundation of project controlling. It compares planned values (target) with actual values — separately for the three dimensions of schedule, cost, and scope.
A simplified example for a software project:
| Work Package | Cost Target | Cost Actual | Schedule Target | Schedule Actual | Cost Variance | Schedule Variance |
|---|---|---|---|---|---|---|
| Requirements analysis | €15,000 | €14,200 | Feb 28 | Feb 28 | −€800 | 0 days |
| System design | €20,000 | €22,500 | Mar 31 | Apr 7 | +€2,500 | +7 days |
| Implementation | €45,000 | €38,000 | Jun 30 | ongoing | −€7,000* | open |
| Testing | €12,000 | – | Jul 31 | – | – | – |
Status as of mid-May; work package not yet complete
The numbers alone say little. Only the analysis explains whether the cost overrun in system design was a one-time effect (e.g., an additional workshop with the client) or points to a structural problem (underestimated hourly rate). And the apparent cost saving in implementation must be viewed in the context of the degree of completion — spending less money while achieving fewer results is no saving at all.
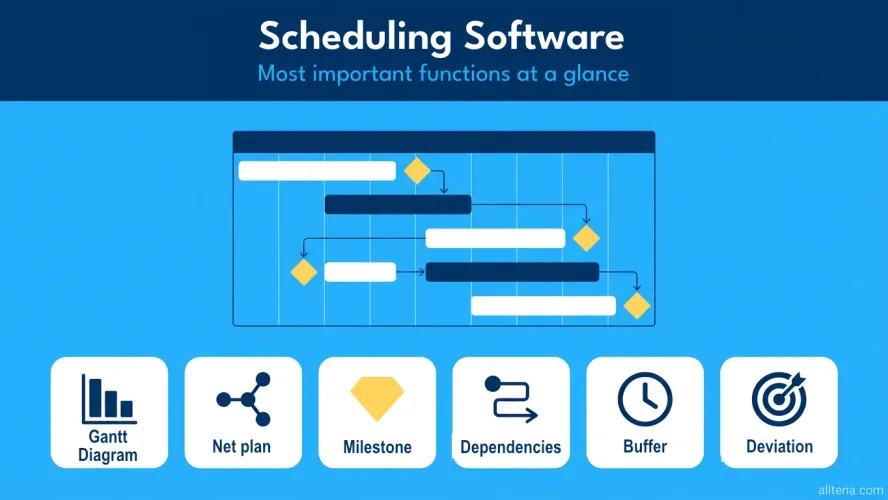
Milestone Trend Analysis (MTA)
The milestone trend analysis is a visual tool for monitoring the schedule situation. The horizontal axis shows the reporting dates; the vertical axis shows the projected milestone dates. For each milestone a line is drawn that shows how the schedule forecast has evolved over time.
The interpretation is intuitive:
- Horizontal line: The milestone is stable and on track.
- Rising line: The milestone is shifting backward — schedule delay.
- Falling line: The milestone will be reached earlier than planned.
The key advantage: the MTA shows trends, not just snapshots. A milestone that slips by one week at every reporting date signals a structural problem — even if the absolute delay still appears small.
The MTA is particularly useful as a communication tool with clients and steering committees, because it makes project status visible at a glance. We cover additional scheduling methods in a dedicated article.
Earned Value Analysis (EVA)
Earned Value Analysis links the three target dimensions — cost, time, and scope — in a single set of metrics. It answers the central question: Are we getting the expected progress for our money?
Three base values form the foundation:
- Planned Value (PV): Planned cost of the work scheduled to be completed by the reference date
- Earned Value (EV): Planned cost of the work actually completed by the reference date
- Actual Cost (AC): Actual cost of the work completed by the reference date
From these values, meaningful metrics can be derived:
| Metric | Formula | Interpretation |
|---|---|---|
| Schedule Variance (SV) | EV − PV | Positive = ahead, negative = delayed |
| Cost Variance (CV) | EV − AC | Positive = under budget, negative = over budget |
| Schedule Performance Index (SPI) | EV / PV | > 1 = ahead, < 1 = delayed |
| Cost Performance Index (CPI) | EV / AC | > 1 = efficient, < 1 = more expensive than planned |
EVA is the most powerful tool in project controlling — but also the most demanding. It requires clean planning with valued work packages and disciplined progress measurement. In practice it is therefore best suited to medium and large projects with stable requirements.
Traffic-Light Controlling
Traffic-light controlling is the simplest and most widely used form of project status visualization. Based on the three traffic-light colors, the condition of a work package or the entire project is represented:
- Green: Everything on track — no action required.
- Yellow: Significant plan deviations are threatening — plan measures and monitor.
- Red: Achievement of objectives is at risk — immediate action and escalation required.
The advantage lies in its universal intelligibility. The disadvantage: without a clear definition of what each color means, the rating depends on subjective judgment. What one person calls “yellow,” another rates as “green.” Therefore: the criteria for each color must be defined in advance — ideally with measurable thresholds (e.g., yellow from 10% budget variance, red from 20%).
It is also advisable not to use a single overall traffic light, but separate ones for schedule, cost, and scope. This makes it immediately apparent in which dimension the problem lies.
Degree of Completion
The degree of completion expresses in percentage terms how far a work package or the overall project has progressed. It appears to be a simple metric — but in practice it can be treacherous.
Four common measurement methods:
- 0/100 method: A work package is considered 0% complete while it is in progress, and 100% complete when it is closed. Simple and objective, but coarse.
- 50/50 method: 50% at the start, 100% at completion. Slightly more differentiated, but still heavily simplified.
- Quantity-proportional measurement: Progress is measured against a quantifiable variable — for example, the number of features implemented, test cases completed, or meters of cable laid.
- Remaining effort estimation: Those responsible estimate the effort still needed. The degree of completion results from the ratio of effort expended so far to total planned effort.
Beware of the “90%-done syndrome”: many work packages quickly reach 90% completion but then stall at that level for weeks. The last 10% — bug fixes, documentation, integration — often takes longer than expected. Therefore: always view the degree of completion in the context of the schedule and cost situation.
Tools at a Glance
| Tool | Suitability | Effort | Informational Value |
|---|---|---|---|
| Target-actual comparison | All projects | Low | Medium — delivers raw data; analysis needed |
| Milestone trend analysis | Projects with clear milestones | Low | High for schedule situation |
| Earned Value Analysis | Medium to large projects | High | Very high — links all three dimensions |
| Traffic-light controlling | All projects, management reporting | Very low | Low — overview only, no detail |
| Degree of completion | All projects | Medium | Medium — depends on measurement method |
Project KPIs at a Glance
The tools above each provide a view of schedule, cost, or scope. In practice you will combine several metrics into a lean set — aligned with your project objectives and your steering model. Which KPIs are typically appropriate, how Earned Value, budget, progress, and team indicators work together, and what quality criteria good metrics should meet are covered in the in-depth article Project KPIs at a Glance.
Project Controlling in Practice — Tips
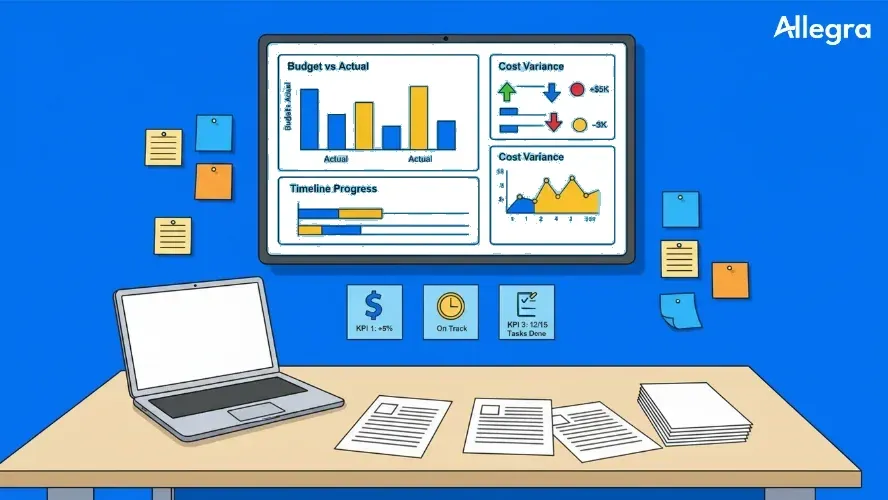
Less is more. Start with three to five metrics, not a comprehensive set of figures. A lean dashboard that is kept up to date is more valuable than an elaborate reporting system that nobody reads. You can always expand later.
Establish a rhythm. Project controlling needs regularity. Define a fixed reporting cycle — for most projects, one- to two-week intervals make sense. A full controlling run should take place at every milestone.
Set it up early. Controlling does not begin only when problems arise — by then it is usually too late. Target values are defined during the planning phase; actual data collection starts with the first work package.
Use variances as information, not accusations. If team members fear being blamed for deviations, problems get concealed rather than reported. The result: controlling shows green when it has long since turned red.
Treat causes, not symptoms. A cost overrun in a work package can have many causes — from a one-time planning error to a systematically underestimated hourly rate. Only by knowing the cause can you find the right remedy.
Document lessons learned. Every project generates controlling data that is valuable for future projects: how accurate were the effort estimates? Which risks materialized? A lessons-learned database improves planning quality with every project.
Frequently Asked Questions
What is project controlling explained simply?
Project controlling is the systematic steering of a project through the regular comparison of planned and actual values for schedule, cost, and scope. The goal is to detect deviations early and initiate corrective measures before the project objective is at risk. The underlying controlling cycle repeats continuously throughout the entire project lifecycle.
What is the difference between project management and project controlling?
Project management encompasses the planning, organization, and execution of the entire project — including team leadership, stakeholder communication, and risk management. Project controlling is a sub-area of project management that focuses on monitoring and steering the three target dimensions of schedule, cost, and scope. It provides the data basis on which project management makes decisions.
What tools are available in project controlling?
The most important tools are the target-actual comparison, milestone trend analysis, Earned Value Analysis, traffic-light controlling, and the measurement of the degree of completion. Additionally, cost-flow and cumulative cost curves and the project status report are used. Which tools make sense depends on the size and complexity of the project. A systematic selection and combination of metrics is described in Project KPIs at a Glance.
Who is responsible for project controlling?
Primary responsibility rests with project leadership. The project manager is responsible for requesting controlling data, evaluating reports, and initiating steering measures. In larger organizations, a project controller supports with data preparation and analysis. Work package owners manage autonomously at their level and escalate when deviations occur.
When does project controlling begin?
Project controlling begins in the planning phase — because that is where the target values are defined against which performance will later be measured. Without clean planning there is no basis for target-actual comparisons. Ideally the first target values are available even earlier: the feasibility analysis in the pre-project phase delivers cost and revenue forecasts that can be carried over directly as target values into controlling. Controlling then accompanies the project through the entire execution phase to closure, where a final target-actual analysis delivers the lessons learned for future projects.

Senior Advisor
Jörg Friedrich is the original author of the project management software Allegra and continues to accompany its development to this day. He has many years of industry experience as a project and department manager. He also serves as a professor in the Faculty of Computer Science and Information Technology at Esslingen University of Applied Sciences.