What is a cost-benefit analysis?
A cost-benefit analysis (also referred to as a feasibility study, economic analysis, or investment appraisal) is an instrument used to determine whether a planned project makes financial sense. The central question is: Is the expected benefit proportionate to the costs?
The analysis is typically conducted in the pre-project phase — that is, before a project is formally launched and resources are committed. If the result is negative, the initiative should not be pursued further. The costs incurred up to that point are manageable; the costs of an uneconomical project would not be.
The cost-benefit analysis is only one side of the coin. Together with the technical and organizational feasibility assessment, it forms the business case — the overall evaluation on the basis of which the decision to approve the project is made.
DIN 69901 uses the related term “project costing”: the identification of cost-relevant project outputs and their valuation. The GPM (German Association for Project Management) speaks of “economic calculation.” Regardless of the term used, the core remains identical: systematically weighing the costs, revenues, and benefits of an initiative to enable a well-founded decision.
What is the purpose of a cost-benefit analysis?
Companies have limited resources — budget, staff, and time. Not every initiative that is technically feasible also makes economic sense. A cost-benefit analysis helps you select the right projects and avoid poor decisions.
Safeguard project selection. When several project alternatives are available, a cost-benefit analysis provides a numbers-based foundation for comparison. Which initiative delivers the highest profit? Which pays itself back fastest? Which has the best return?
Build decision confidence. Gut feeling and experience are valuable, but they are no substitute for numbers. A rigorous analysis makes the financial assumptions transparent and traceable — for management, the steering committee, and all other stakeholders.
Identify risks early. The analysis requires you to forecast costs and revenues. This process forces you to challenge assumptions, name uncertainties, and identify financial risks — long before they surface during project execution. A complementary risk analysis quantifies the probable impact.
Establish a baseline for project controlling. The planned figures determined in the cost-benefit analysis — expected costs, revenues, payback period — feed directly into project controlling as target values. There they are compared with actual results as the project progresses. Without a solid baseline, the target-versus-actual comparison lacks a reference point.
Improve planning quality. After project completion, the post-calculation — comparing the original cost-benefit analysis with the actual results — yields valuable benchmarks. These make future analyses more realistic and reduce estimation errors over time.
When is a cost-benefit analysis carried out?
A cost-benefit analysis is part of the pre-project phase. It is conducted after basic technical feasibility has been confirmed and before the formal project start. Its result — the feasibility study — feeds into the project approval decision.
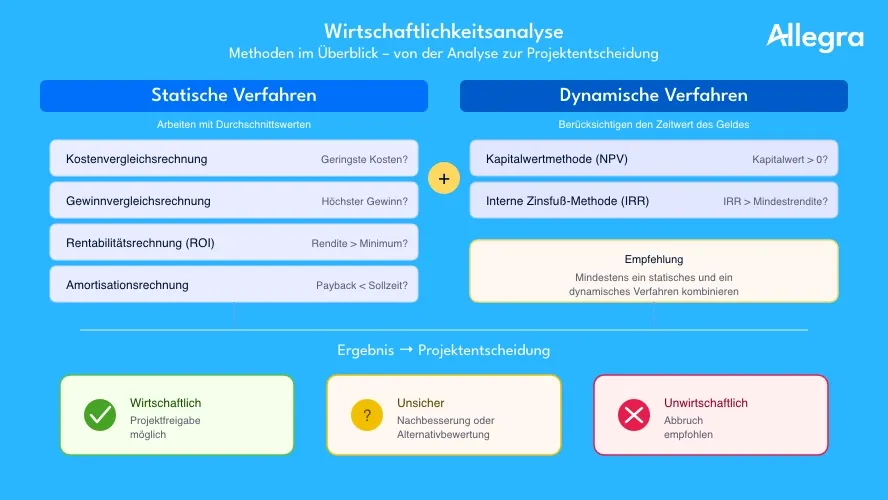
In practice, the result can often be summarized with a traffic-light logic:
- Green: The initiative is economically viable — project approval possible.
- Yellow: Economic viability is uncertain — refinement or evaluation of alternatives required.
- Red: The initiative is not economically viable — abandonment recommended.
The feasibility study itself is generally not updated after the project starts. Its results do, however, flow into ongoing controlling through cost and revenue planning. At the end of the project, a post-calculation is performed, comparing the original assumptions with the actual figures — a valuable learning loop for future projects.
For long-term programs or projects with multiple project phases, the economic assessment can be updated at defined milestones to respond to changed conditions.
Overview: methods of cost-benefit analysis
The approaches to cost-benefit analysis fall into two groups:
Static methods work with average values and do not account for when costs and revenues occur. They are straightforward to apply and are suitable for an initial assessment.
Dynamic methods account for the time value of money: one euro today is worth more than one euro in three years, because it can be invested in the meantime. By discounting future payments back to the point of investment, they deliver more accurate results.
| Category | Method | Core question |
|---|---|---|
| Static | Cost comparison | Which alternative has the lowest costs? |
| Profit comparison | Which alternative generates the highest profit? | |
| Return on investment (ROI) | What is the return on the capital employed? | |
| Payback period analysis | How quickly does the invested capital flow back? | |
| Dynamic | Net present value (NPV) method | Do the discounted inflows exceed the outflows? |
| Internal rate of return (IRR) method | At what interest rate does the net present value equal zero? |
In practice, it is advisable to combine at least two methods — one static, one dynamic. This makes it visible whether the results point in the same direction or whether one method has blind spots.
Static methods
Cost comparison
The simplest method: the project costs of different alternatives are placed side by side. The alternative with the lowest costs is selected.
Cost comparison only yields a meaningful result when the alternatives deliver the same output. If revenues differ, costs per unit of output must be compared — for example, costs per euro of revenue.
Strength: Extremely simple; delivers a quick first overview. Weakness: No statement about absolute viability; ignores revenues and the timing of payments.
Profit comparison
Profit comparison brings revenues into the picture: Profit = Revenue − Costs. The alternative with the highest profit is selected.
Strength: Takes into account that projects are expected not only to cost money, but also to generate returns. Weakness: No statement about whether the profit meets the company’s required minimum return. A project with a positive profit can still be uneconomical if the return falls below the company’s target.
Return on investment (ROI)
The ROI calculation relates profit to the capital employed:
ROI = Profit × 100 / Capital employed
The result is compared with the minimum return defined internally by the company. Only when the project’s return exceeds this threshold is it absolutely advantageous — not merely better than an alternative.
The minimum return typically ranges from 5 to 15 % depending on the industry. The capital employed corresponds to the total project costs or the approved project budget.
Strength: For the first time, a statement about whether the project is worthwhile for the company overall. Weakness: Does not account for when the profits occur.
Payback period analysis
Payback period analysis determines the payback period — the time until the capital employed has been recovered through surplus revenues:
Payback period = Capital employed / Average annual surplus revenue
Companies often define a target payback period (frequently two to four years). Only projects that pay back within this timeframe are approved.
Strength: Easy to understand; provides a clear time perspective. Weakness: Ignores revenues after the payback point. A project that pays back in three years and then delivers returns for 20 years is rated identically to one with the same payback period but no subsequent returns.
Dynamic methods
All static methods share a fundamental weakness: they treat one euro today and one euro five years from now as equivalent. Dynamic methods correct this by discounting future payments back to the point of investment.
Net present value (NPV) method
The NPV method sums all discounted inflows and outflows of a project over its entire duration. The resulting value — the net present value (NPV) — shows whether the project is economically viable after accounting for the time value of money.
- NPV > 0: The project generates more than the required minimum return — it is advantageous.
- NPV = 0: The project exactly meets the minimum return.
- NPV < 0: The project does not meet the minimum return — it is uneconomical.
When comparing several alternatives, the one with the highest positive NPV is preferred.
Strength: Accounts for the timing and absolute magnitude of all payments. Weakness: The result depends heavily on the chosen discount rate. Small changes in the rate can reverse the ranking of alternatives.
Internal rate of return (IRR) method
The IRR method determines the interest rate at which a project’s net present value is exactly zero. This rate — the internal rate of return (IRR) — is then compared with the minimum return defined by the company.
- IRR > minimum return: The project is economically viable.
- IRR < minimum return: The project does not meet requirements.
The advantage over the NPV method: results can be communicated as a percentage, which is more intuitive for many decision-makers than an absolute euro figure.
Strength: Independent of the chosen discount rate; result as a percentage is easy to communicate. Weakness: Calculation requires iteration (in practice via spreadsheet); for unusual cash flow patterns, multiple solutions may exist.
Cost-benefit analysis and the business case
Not every project benefit can be expressed in euros. Customer satisfaction, market acceptance, brand value, or compliance requirements have no market price — yet they are often just as relevant to the decision as the hard numbers.
Cost-benefit analysis
A cost-benefit analysis captures qualitative benefit potential alongside monetary benefits. Effects that cannot be quantified are estimated and weighted by multiple experts to produce the most objective picture possible. It is particularly suited to projects whose primary benefit is not directly measurable in revenues — such as internal process optimizations or compliance projects.
Business case
The business case is the comprehensive overall evaluation of a project initiative. It combines the economic calculation with scenario descriptions, strategic assessments, documented assumptions, and risks. In PRINCE2, the business case is a mandatory component of the project handbook and is updated at every milestone.
A complete business case includes:
- Scenario description: Expected impacts compared with continuing the status quo
- Benefit forecast: Results of the economic calculation (NPV, ROI, payback period)
- Assumptions and conditions: Documented underlying assumptions on which the calculation is based
- Risk assessment: Identified risks and their financial impact
Important: every change request during the project should be checked for its impact on the business case. If the projected benefit is no longer achievable, the project must be reassessed or terminated.
Practical example: cost-benefit analysis for an IT project
A mid-sized company wants to digitize its customer service. Two alternatives are under consideration:
- Alternative A: In-house development of a ticketing platform
- Alternative B: Introduction of a SaaS solution with customizations
The controlling department has calculated the following planned figures for a five-year period (all amounts in thousands of euros):
| Alternative A (In-house development) | Alternative B (SaaS solution) | |||
|---|---|---|---|---|
| Year | Costs | Savings/Revenue | Costs | Savings/Revenue |
| 1 | 180 | 0 | 90 | 0 |
| 2 | 40 | 60 | 35 | 55 |
| 3 | 30 | 80 | 35 | 70 |
| 4 | 25 | 90 | 35 | 70 |
| 5 | 25 | 90 | 35 | 70 |
| Total | 300 | 320 | 230 | 265 |
Profit comparison
- Alternative A: 320 − 300 = profit of €20k
- Alternative B: 265 − 230 = profit of €35k
Based on the profit comparison, Alternative B is preferred.
Return on investment
- Alternative A: 20 × 100 / 180 = 11.1 % (based on the initial investment)
- Alternative B: 35 × 100 / 90 = 38.9 %
Both alternatives exceed an assumed minimum return of 10 %. Alternative B is significantly more profitable.
Payback period
- Alternative A: The cumulative profits (savings minus ongoing costs) recover the initial investment of €180k after approximately 4 years.
- Alternative B: The initial investment of €90k is recovered after just under 2.5 years.
With a target payback period of 3 years, only Alternative B would be eligible for approval.
Net present value (discount rate 8 %)
When the annual surplus cash flows (savings minus ongoing costs) are discounted and the initial investment is deducted, the result is:
- Alternative A: NPV ≈ −€18k (negative — the minimum return is not achieved)
- Alternative B: NPV ≈ +€22k (positive — economically advantageous)
Conclusion from the example
All four methods confirm Alternative B as the more economical choice. In practice, this is not always so clear-cut: a cost comparison and payback analysis can lead to a different recommendation than a profit or NPV assessment. That is precisely why combining multiple methods matters.
Beyond this, strategic factors must be considered: in-house development offers greater long-term flexibility and independence from the vendor, while the SaaS solution becomes productive faster but incurs ongoing licensing costs. These trade-offs can complement the numbers from the cost-benefit analysis, but they cannot replace them.
Practical tips
Combine multiple methods. A single method provides only one perspective. Combining at least one static and one dynamic method makes the result more robust. If both point in the same direction, the reliability of the conclusion increases substantially.
Document assumptions transparently. Every cost-benefit analysis is based on estimates — expected costs, projected revenues, assumed interest rates. These assumptions must be documented so they can be adjusted when conditions change. An effort estimation using recognized methods improves the quality of the input data.
Account for non-monetary benefits. Some projects do not make sense in purely financial terms, yet deliver strategic value — market position, compliance, employee satisfaction. A cost-benefit analysis captures these aspects at least qualitatively. Do not ignore them simply because they cannot be forced into a formula.
Ensure the quality of input data. The best method is worthless if the underlying cost and revenue estimates are unrealistic. Involve subject matter experts, draw on benchmarks from past projects, and challenge optimistic forecasts.
Conduct a post-calculation. After the project ends, the original assumptions from the cost-benefit analysis should be compared with the actual results. This step is frequently skipped in practice, yet it is the most valuable source for more realistic analyses in the future.
Use the right software. Project management software with integrated cost controlling delivers reliable actuals for the post-calculation and makes the transition from cost-benefit analysis to ongoing target-versus-actual comparison seamless.
Supporting cost-benefit analysis with software
In the pre-project phase, a spreadsheet is often sufficient for the actual calculations. Once the project has started, however, the real challenge begins: the planned figures assumed in the cost-benefit analysis must be compared with actual costs and results.
This is precisely where project management tools demonstrate their strength:
- Record planned costs: Project budgets are defined per work package — the target values from the cost-benefit analysis feed in directly.
- Capture actual costs automatically: Working hours, material costs, and third-party services are documented where the work happens.
- Target-versus-actual comparison via dashboard: Variances are displayed visually so that the need for action is immediately apparent.
- Post-calculation without data breaks: At the end of the project, all the data needed to compare the original cost-benefit analysis with reality is available.
Allegra combines task, project, and cost management in a single platform. The Earned Value Analysis links costs, time, and performance in one set of metrics — for maximum transparency into the financial progress of a project.
Frequently asked questions
What is a cost-benefit analysis in simple terms?
A cost-benefit analysis checks, before a project starts, whether an initiative makes financial sense. To do this, the expected costs are weighed against the expected revenues or savings. The result shows whether the project pays off and, when multiple options exist, which alternative is the most economical.
What is the difference between static and dynamic methods?
Static methods calculate with average values and ignore the timing of payments. Dynamic methods discount future payments back to the point of investment and therefore deliver more accurate results. In practice, it is advisable to combine at least one method from each category.
When should a cost-benefit analysis be carried out?
In the pre-project phase, after the technical feasibility assessment and before formal project approval. For long-term projects, the assessment can be updated at defined milestones to respond to changed conditions.
What is the difference between a cost-benefit analysis and a business case?
A cost-benefit analysis is one component of the business case. It provides the financial evaluation (ROI, payback period, NPV). The business case additionally encompasses scenario descriptions, strategic assessments, documented assumptions, and a risk assessment. It is the decision-making foundation for project approval.
Which cost-benefit analysis method is the best?
There is no single “best” method — each has strengths and blind spots. The combination of an ROI or payback period analysis (static) with the NPV method (dynamic) delivers the most robust results in practice. When both methods point to the same recommendation, the decision rests on solid ground.

CEO Alltena GmbH
Christoph Friedrich is a computer scientist and certified Project Management Professional. He has extensive experience in the introduction and integration of project management tools as well as the analysis and definition of processes in project and service management.