
What is a target/actual comparison?
A target/actual comparison sets planned target values (target) against the results actually achieved (actual). The difference between the two — the variance — shows whether a project, a budget, or a process is on track.
The term originally comes from cost accounting, where target costs and actual costs are compared in standard cost accounting. Today the target/actual comparison is widespread far beyond accounting: in project management it is the central tool for systematically monitoring schedules, costs, and scope.
One important distinction: a target/actual comparison is not a control instrument in the sense of checking individuals. It is a steering instrument — comparable to a vehicle’s dashboard. The readings show where the project stands and enable the project manager to correct course in time.
The target/actual comparison forms the core of the project controlling cycle: plan, measure, compare, analyze, act. Without this comparison, the link between plan and reality is missing — and with it, the basis for any steering decision. Which actual and target figures you typically capture and how to shape them into a lean KPI set is summarized in project metrics at a glance.
What is the target/actual comparison for?
The target/actual comparison serves several functions simultaneously. It acts as an early-warning system, a decision-making basis, and a source of learning.
-
Identify variances early. When planned and actual values are compared regularly, differences become apparent before they turn critical. A cost overrun of 5% after the first project phase is manageable — a 30% overrun at the end of the project is not.
-
Make well-founded decisions. Without data, every decision remains gut instinct. The target/actual comparison provides the numbers on which the project manager can base decisions about corrective actions, budget supplements, or schedule adjustments.
-
Create transparency. Clients and stakeholders want to know where their project stands. A clean target/actual comparison makes the status traceable — in the project status report, in the steering committee, or in the team meeting.
-
Improve planning quality. Every comparison yields insights for the next round of planning. Was the effort estimation too optimistic? Were certain risks underestimated? These lessons learned make future projects more predictable — and improve the accuracy of future cost-benefit analyses.
-
Keep the three target dimensions in view. In the project management triangle, costs, schedules, and performance exist in a state of tension. The target/actual comparison shows in which dimension the project deviates from the plan — and whether a shift in one dimension affects the others.
Process of a target/actual comparison
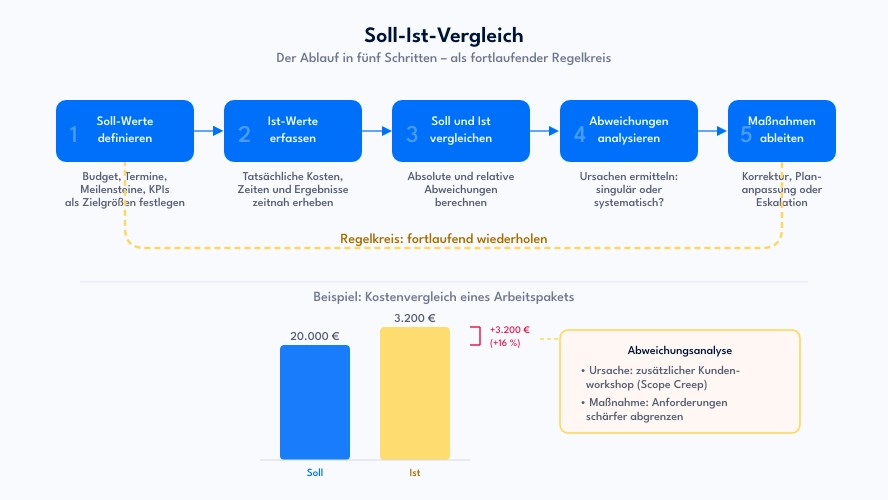
A structured target/actual comparison follows five steps. In practice, these steps repeat regularly — they are part of the controlling cycle that accompanies a project throughout its entire duration.
1. Define target values
Everything begins with clear planning. Without measurable target figures, there is nothing to compare against. The target values are derived from the project objectives in the planning phase and documented in the project plan.
Typical target values in project management:
- Costs: Project budget per work package or project phase
- Schedules: Planned start and end dates, milestones
- Performance: Planned degree of completion, number of completed work packages, quality metrics
The more concrete the target values, the more meaningful the subsequent comparison. “The project should roughly stay within budget” is not a usable specification. “The system design work package is planned at €20,000 and a duration of four weeks” is.
2. Capture actual values
In the ongoing project, the actual data are collected: hours worked, costs incurred, results achieved, actual dates. These actual values must be captured promptly and reliably — outdated or falsified data render the entire comparison worthless.
In practice this means: working hours are booked promptly, costs are recorded per project, and the degree of completion is assessed regularly. Project management software greatly facilitates this step because actual data arise where the work takes place.
3. Compare target and actual
Now the planned and actual values are set against each other. Both absolute variances (e.g., +€3,500) and relative variances (e.g., +17.5%) should be calculated. Absolute values show the magnitude; relative values show the proportionality.
In this step you compare — you do not yet evaluate. The premature interpretation — “That’s way too expensive!” — frequently leads to the wrong actions. Only the next step gives the numbers meaning.
4. Analyze variances
The variance analysis is the decisive step. Here it is investigated why target and actual differ from each other. Three questions help with the assessment:
- Is the variance relevant? Small differences fall within normal planning uncertainty and require no action.
- Is the variance isolated or systematic? A one-off effect (e.g., an unplanned workshop) is treated differently from a structural misjudgment (e.g., consistently too-low hourly rate assumptions).
- What is the cause? Typical causes are planning errors, scope creep, resource bottlenecks, external delays, or changed requirements.
5. Derive actions
Based on the analysis, corrective actions are defined. These range from minor course corrections to fundamental plan adjustments:
- Corrective actions: Deploy additional resources, re-prioritize work packages, optimize processes
- Plan adjustment: Increase budget, shift deadlines, adjust scope
- Escalation: Bring in the steering committee when the variance exceeds the project manager’s authority
Project control implements these actions — and the next target/actual comparison shows whether they have had an effect.
Practical example: target/actual comparison in a software project
A company is developing a customer portal. The project spans six months, with a total budget of €120,000. After three months the project manager performs a target/actual comparison:
| Work package | Target costs | Actual costs | Variance | Variance % |
|---|---|---|---|---|
| Requirements analysis | €12,000 | €11,400 | −€600 | −5.0% |
| UX design | €18,000 | €21,200 | +€3,200 | +17.8% |
| Backend development | €35,000 | €19,500 | −€15,500 | −44.3% |
| Frontend development | €30,000 | €8,000 | −€22,000 | −73.3% |
| Testing | €15,000 | – | – | – |
| Rollout | €10,000 | – | – | – |
| Total | €120,000 | €60,100 | −€59,900 |
At first glance things look good: halfway through the project timeline, only 50% of the budget has been spent. But the numbers tell a more nuanced story:
- UX design: 17.8% over budget. The analysis reveals: after the first draft, the client submitted extensive change requests that were not included in the original scope. Cause: insufficient requirements clarification upfront.
- Backend development: Seemingly 44% under budget — but the degree of completion is only 40% instead of the planned 60%. In terms of cost per unit of output, the costs are actually above plan.
- Frontend development: Barely started, because the backend team is behind schedule and the interfaces are not yet in place.
The simple cost view is misleading here. Only in combination with the degree of completion does it become apparent that the project has both a cost problem and a schedule problem. For a deeper analysis, Earned Value Analysis is well suited — it links costs, time, and performance in a single metrics system.
Actions in this example:
- Scope clarification with the client for the remaining phases, to prevent further scope creep
- Additional backend resources to make up the schedule delay
- Adjustment of the timeline for frontend development and testing
Areas of application in project management
The target/actual comparison can be applied to all dimensions of project management. Depending on the question, different key figures move into focus. A thematic overview of common metrics — from time and budget to risk and team — can be found at project metrics at a glance.
Cost controlling
The classic use case: planned and actual costs are compared per work package, project phase, or cost center. Regular cost comparisons show whether the project budget is sufficient or whether corrective action is required.
Schedule controlling
Planned and actual dates are reconciled — for individual work packages, milestones, or the project as a whole. Combined with milestone trend analysis, you can identify not only the current delay but also the trend: is a deadline slipping further back with each reporting point?
Performance controlling
Here the planned degree of completion is compared with the actual one. This comparison is especially meaningful in combination with cost controlling: lower costs with lower performance is not a saving.
Resource controlling
Planned and actual utilization of team members are set against each other. This helps identify over- or under-utilization and adjust capacity planning. A systematic view of workload across multiple projects makes bottlenecks visible before they become a problem.
Beyond project management
The target/actual comparison is not limited to projects. In cost accounting it compares target and actual costs per cost center; in sales, planned and actual revenues; in workforce planning, planned and actual capacities. The principle is always the same: systematically set plan against reality, identify variances, act.
Tips for a meaningful target/actual comparison
A target/actual comparison is only as good as its data foundation and its interpretation. The following tips help avoid typical pitfalls.
Set realistic target values. Unrealistic planned values make every comparison worthless. If the budget is too tight from the start, every comparison will show red figures — without the project manager having done anything wrong. A solid effort estimation is the prerequisite for meaningful comparisons.
Compare regularly. A target/actual comparison performed once at the end of a project is a post-mortem, not controlling. Fixed intervals make sense — weekly, bi-weekly, or at each milestone. In agile projects, a comparison after each sprint is a natural fit.
Show both absolute and relative variances. A €5,000 overrun sounds harmless on a €500,000 project, but dramatic on a €20,000 project. Both perspectives belong in the evaluation.
Include prior-year or reference values. For recurring project types it is worth comparing with past projects. This makes trends visible: are effort estimates systematically exceeded? Are there certain phases that regularly go off the rails?
Look for causes, not culprits. The target/actual comparison serves process optimization, not blame attribution. Anyone who uses variances as an occasion for accusations ensures that future problems are concealed rather than reported.
Use suitable software. Manual maintenance in spreadsheets works for small projects but becomes error-prone and time-consuming as complexity grows. Project management software such as Allegra captures actual data where the work takes place and provides target/actual comparisons via dashboard.
Supporting the target/actual comparison with software
Many teams start with a spreadsheet — and that works well for manageable projects. But as project complexity increases, the manual approach reaches its limits: data is entered late, formulas are error-prone, and different versions circulate at the same time.
Project management software solves these problems by connecting planning and execution in a single system:
- Automatic actual capture: Working hours, costs, and progress are documented directly in the tool — not retroactively in a separate spreadsheet.
- Target/actual dashboards: Current variances are displayed visually, often with traffic-light logic for a quick overview.
- Drill-down to work packages: From the overall project you can navigate down to individual tasks to pinpoint the cause of a variance.
- Historical comparisons: Past projects serve as a reference for planning new endeavors.
Allegra combines task, project, and cost management in one platform. Target values are defined in project planning; actual values arise through the daily work of team members. Target/actual comparisons and status reports can be generated from this without any media break.
Frequently asked questions
What is a target/actual comparison in simple terms?
A target/actual comparison sets planned values (target) against the results actually achieved (actual). The difference reveals variances whose causes are analyzed in order to initiate corrective actions. The method is a central instrument of project controlling.
What is the difference between target and actual values?
Target values are the planned objective figures — for example a budget of €50,000 or a completion date of 30 June. Actual values are the results actually measured — for example actual costs of €54,000 or a real completion date of 15 July. The difference between the two is the variance.
How often should a target/actual comparison be performed?
The frequency depends on the project. In most cases, comparisons every one to two weeks make sense. In addition, a complete target/actual comparison should take place at every milestone. In agile projects, a comparison after each sprint is a natural fit.
What is a variance analysis?
The variance analysis examines the causes of the difference between target and actual. It clarifies whether a variance is negligible, isolated, or systematic, and forms the basis for selecting appropriate corrective actions.
What tools are suitable for a target/actual comparison?
For simple projects a spreadsheet is sufficient. As complexity grows, project management software such as Allegra, Jira, or MS Project is recommended — it automatically consolidates target values from planning and actual values from project execution and presents them as a dashboard.

CEO Alltena GmbH
Christoph Friedrich is a computer scientist and certified Project Management Professional. He has extensive experience in the introduction and integration of project management tools as well as the analysis and definition of processes in project and service management.